A100 vs H100: When GPU Prices Break Out of Sync
Despite belonging to the same AI infrastructure ecosystem, A100 and H100 GPU rental prices diverge.

Introduction: Two GPUs, Diverging Paths
The NVIDIA A100 and H100 GPUs are the core engines of the AI boom, powering everything from LLM training to inference at scale. With both operating in the same ecosystem, one might assume their rental prices would move in tandem.
But recent market behavior reveals a far more complex picture.
Through a detailed analysis of Silicon Data’s proprietary rental indices, it’s clear that while A100 and H100 markets are structurally linked, they follow distinct pricing paths, shaped by different catalysts, user segments, and market timing.
H100 Cooled Off First — A100 Followed With Force
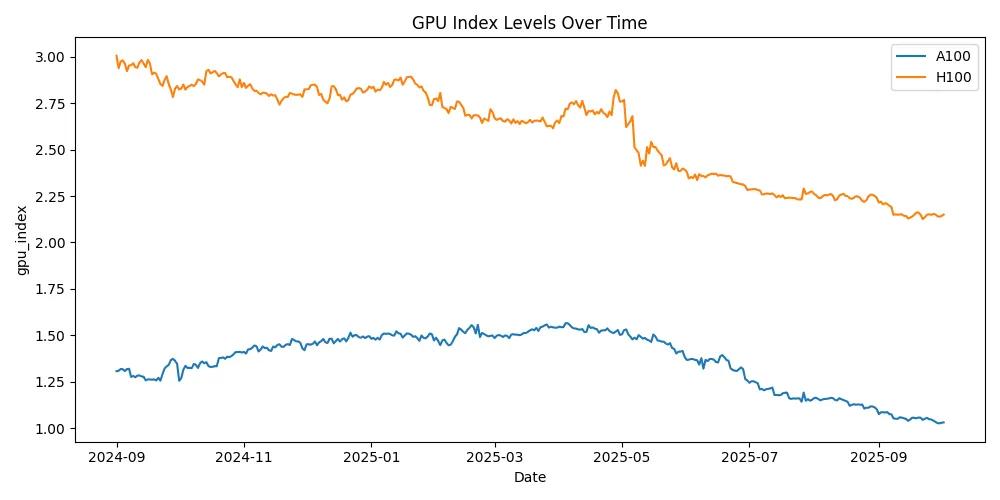
At the height of GPU scarcity in late 2024, H100 rental prices soared near 3.0, driven by overwhelming demand for frontier model training and limited early supply. As infrastructure caught up and hyperscaler cycles matured, H100 prices began a gradual but steady decline.
In contrast, the A100 Index climbed more slowly, peaking later in the cycle. However, when correction hit mid-2025, it fell more sharply, reflecting the dynamics of a broader, liquidity-sensitive secondary market.
This divergence demonstrates how each GPU responds to different forces:
- H100 pricing reacts to hyperscaler training waves, new model launches, and early-mover shortages.
- A100 pricing is more influenced by inference workloads, long-tail usage, and secondary market liquidity.
As next-gen GPUs like Blackwell (GB200) loom on the horizon, both markets have compressed—but on asynchronous schedules.
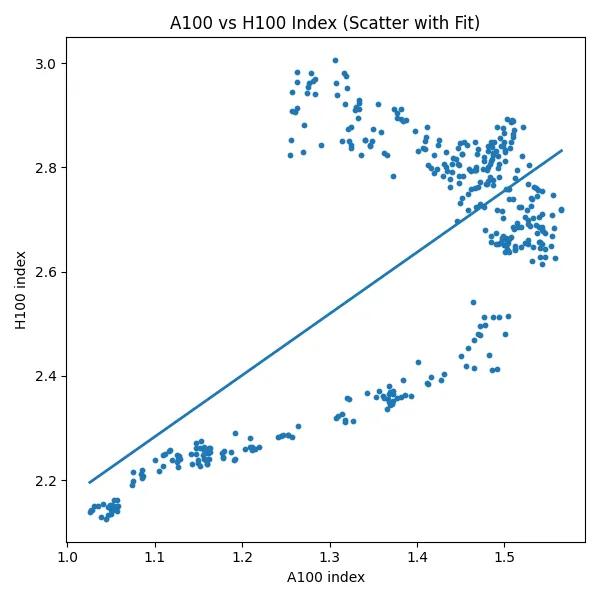
They Move Together — But Not Always Cleanly
While A100 and H100 indices show a general positive correlation, their relationship is riddled with noise. Scatter plot analyses confirm a structural link between the two—since they share macro demand/supply drivers—but many idiosyncratic pricing forces influence each chip independently.
Key distinctions:
- A100 serves a broader, more mature market, including inference, mid-tier training, and edge workloads.
- H100 remains concentrated in high-end, hyperscaler-dominated environments, heavily tied to major LLM training cycles.
This explains why one chip might surge or stall while the other stays flat. For example, a drop in H100 pricing post-training run doesn’t always reflect reduced demand for A100 workloads.
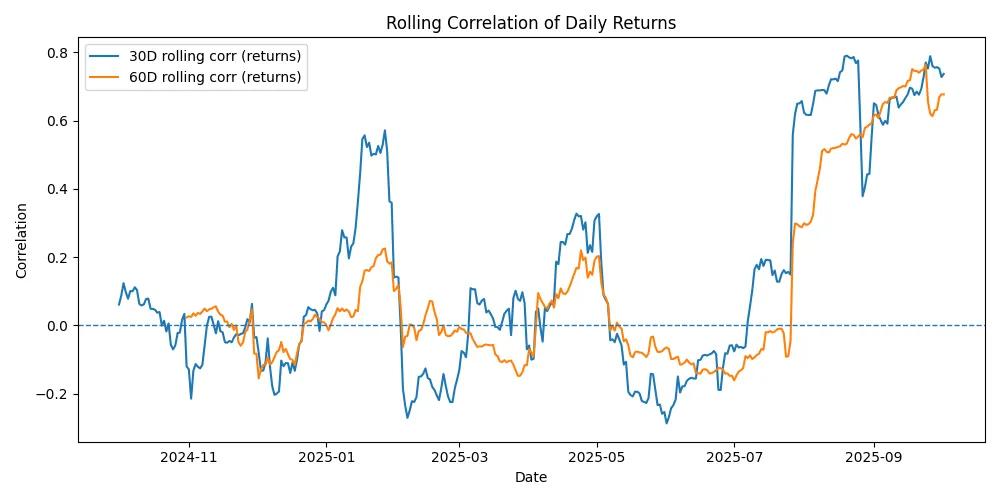
Correlations Are Regime-Dependent, Not Static
Correlation data across 30- and 60-day return windows reveal dramatic swings from -0.2 to +0.8:
- Late 2024 to Spring 2025: Correlations were near zero or negative, driven by asynchronous demand shocks.
- Mid-2025 onward: Correlations stabilized in the 0.6–0.8 range, as macro events like global supply repricing and GB200 speculation synchronized market behavior.
This insight is critical: correlation regimes shift based on market structure, not just pricing history. Traders relying on static hedging models may find themselves exposed when the regime turns.
No Chip Clearly Leads the Other
Cross-correlation studies reveal no strong lead-lag pattern between A100 and H100 prices. Occasionally, H100 may lead A100 by a few days—but overall, movements appear parallel or isolated.
Why?
Each chip reacts to different supply flows, end-user segments, and usage patterns. Market shifts happen quickly, and pricing tends to adjust simultaneously in response to shared macro or product cycle shocks.
Why This Matters: Practical Implications for Stakeholders
For Traders and Hedge Funds
Avoid assumptions of consistent correlation. Use dynamic models that detect regime changes and factor in chip-specific drivers for more effective hedging and pair trade setups.
For Infrastructure Buyers
Procurement timing should be aligned with shifts in correlation and pricing regime. A drop in H100 doesn’t always mean A100 will follow—so adjust acquisition strategies accordingly.
For Product Creators and Exchanges
As GPU-based financial products evolve, understanding the volatility divergence and asynchronous pricing structures between A100 and H100 is vital for index creation, options pricing, and structured product design.
Conclusion: Same Ecosystem, Separate Timelines
The A100 and H100 marketsmay serve the same AI infrastructure domain—but their behaviors often diverge. Correlations fluctuate, pricing cycles differ, and no chip consistently leads the other.
In this evolving environment, it’s no longer enough to view GPUs as a unified asset class. Instead, market participants must track both chips independently—watching for structural shifts, unique drivers, and correlation regime changes to stay ahead.
Silicon Data provides real-time rental indices and GPU market insights to help you optimize compute strategy, hedge effectively, and design data-driven financial products.