H100 Rental Market Cools in September: Price Index Slips as Volatility Rises
H100 GPU Rental Index showed signs of softening in September, accompanied by a rise in volatility.

Introduction: Shifting Winds in the GPU Rental Market
September brought a noticeable shift to the previously stable H100 GPU rental landscape. For much of 2025, the market demonstrated impressive consistency, particularly in August, where the Silicon Data H100 Rental Index (Bloomberg Ticker: SDH100RT) moved within a narrow range. However, as the calendar turned to September, a modest but clear decline set in, paired with a significant uptick in price volatility. These signals suggest underlying changes in both supply and demand forces, as well as broader sentiment shifts within the AI infrastructure market.
From Stability to Softening: The Numbers Behind the Trend
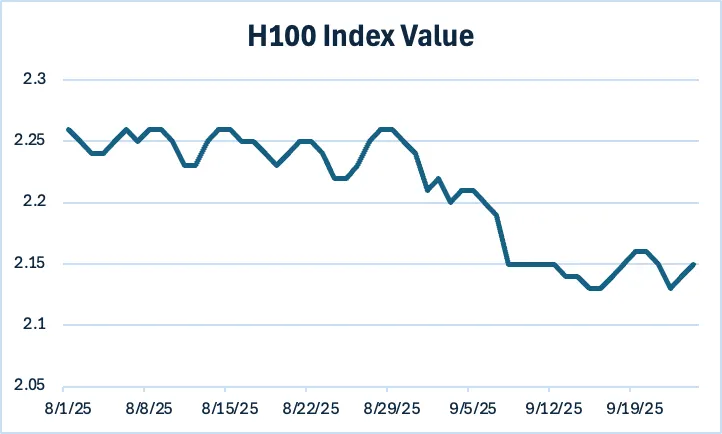
In August, the H100 Rental Index held steady, fluctuating modestly between 2.22 and 2.26, with extremely low volatility (~1.7%). This consistency pointed to a balanced market environment—one in which demand from AI workloads and hedge fund compute cycles matched available rental capacity.
By mid-September, the index dipped as low as 2.13, before staging a mild recovery toward 2.16 as the month closed. While this drop may seem marginal on the surface, the increased price swing (~3.2%) reflects rising uncertainty and a shift in market dynamics. The temporary recovery hints at renewed demand at lower pricing levels, but the market remains on watch for further movements.
What’s Behind the Market Movement?
Several converging factors contributed to the cooling of the H100 rental market:
1. Seasonal Demand Patterns
August typically marks a seasonal slowdown in high-volume AI training. Many institutions pause or reduce their workload allocations ahead of the more intensive Q4 development and release cycles. This lull likely supported the stability observed in August, while the softening in September aligns with this transitional phase before year-end ramp-ups.
2. Increased Supply from New Deployments
September may have seen a meaningful increase in available H100 capacity. Reports suggest several new GPU clusters came online across North America, Europe, and the Middle East, easing supply constraints that had previously buoyed pricing.
3. Strategic Pauses by Key Players
Major GPU consumers—such as hedge funds, AI research labs, and hyperscalers—may have temporarily scaled back usage to manage budgets or prepare for Q4 compute bursts. These pauses can temporarily suppress demand and contribute to downward pricing pressure.
4. Forward-Looking Market Sentiment
Chatter around NVIDIA’s upcoming Blackwell/GB200 series has gained momentum in recent months. Market participants anticipating next-generation chips may be adjusting procurement strategies, pushing down current H100 rental demand as expectations shift.
Key Market Signals to Monitor
While the price drop may appear modest, the current market trajectory offers critical insights:
- Support Zone: The 2.13–2.15 range established in mid-September may represent a short-term floor, where demand begins to reassert itself.
- Stabilization Threshold: If pricing consistently holds above 2.15, it could indicate renewed market equilibrium.
- Warning Signal: A decisive move below 2.10 would signal a more significant correction in the GPU rental economy.
Investors and operators should closely track these movements, as they may provide early signals of broader trends in AI infrastructure demand.
Relative Volatility: GPU Rentals vs. Commodities
Despite September’s bump in volatility, the H100 Rental Index remains one of the more stable benchmarks among high-demand infrastructure assets. When compared to traditional commodities—like oil or natural gas—the GPU rental market demonstrates substantially lower volatility, and in calmer periods, it even rivals the stability of gold.
This relative calm stems from the predictable nature of supply, which is primarily driven by planned infrastructure investments and cluster launches, and demand that is workflow-driven, often tied to long-term contracts rather than speculative trading.
In contrast, commodity markets are subject to geopolitical shocks, weather disruptions, and reactive speculation—factors largely absent from the AI compute sector.
What’s Next: The A100 Rental Index Is Coming
Looking ahead, Silicon Data is preparing to launch the A100 Rental Index, which will offer a parallel benchmark to the H100 index. This initiative will provide deeper insight into GPU pricing trends, particularly the volatility relationship between current-gen (H100) and previous-gen (A100) hardware.
Key questions the new index aims to answer include:
- How correlated are H100 and A100 rental prices?
- Does demand shift fluidly between the two tiers?
- How do volatility profiles compare in dynamic markets?
By offering visibility into both indices, we aim to empower market participants with the intelligence needed to navigate a rapidly evolving compute landscape.
Stay Ahead with Silicon Data
At Silicon Data, we continue to provide transparent, real-time benchmarks for GPU rentals, empowering stakeholders across the AI, finance, and cloud industries with data-driven insights. Access daily index values, historical pricing trends, and expert commentary to stay ahead of every shift in the GPU economy.