How A100 and H100 Prices Vary Across U.S. Regions and Supply Sources
A100 and H100 GPU rental prices differ across U.S. regions and between hyperscalers and marketplaces.

##
Introduction: GPU Pricing Moves from Scarcity to Strategy
As AI workloads expand rapidly across industries, GPU rental pricing is no longer a simple function of demand—it has become a strategic lever shaped by supply chains, geography, and sourcing models. This report examines how A100 and H100 GPUs, the backbone of modern AI compute, are priced across the U.S., comparing traditional hyperscalers with emerging marketplace providers.
The result? A new landscape where cost efficiency, flexibility, and regional strategy are reshaping how organizations access and optimize compute.
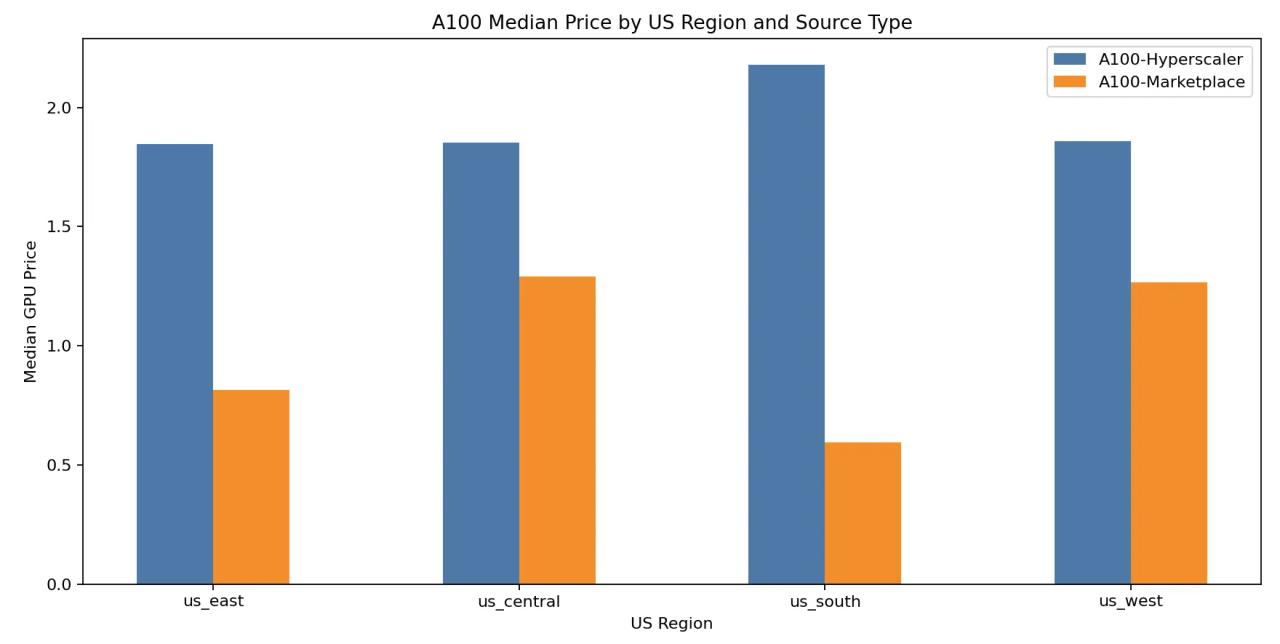
A100 Pricing: Marketplaces Outperform Hyperscalers
Across all major U.S. regions, marketplace providers offer consistently lower rental prices for A100 GPUs compared to hyperscalers.
Regional Insights:
- US East and Central: Discounts of 30–50% over hyperscaler rates.
- US South: The largest gap—suggesting abundant unused capacity in secondary data centers.
- US West: Discounts narrow but persist, despite elevated demand near AI hubs like Seattle and San Francisco.
Key Takeaway:
The A100 rental market has matured. Buyers seeking flexibility and lower costs are increasingly turning to marketplace options, which now deliver predictable pricing and broad regional availability.
##
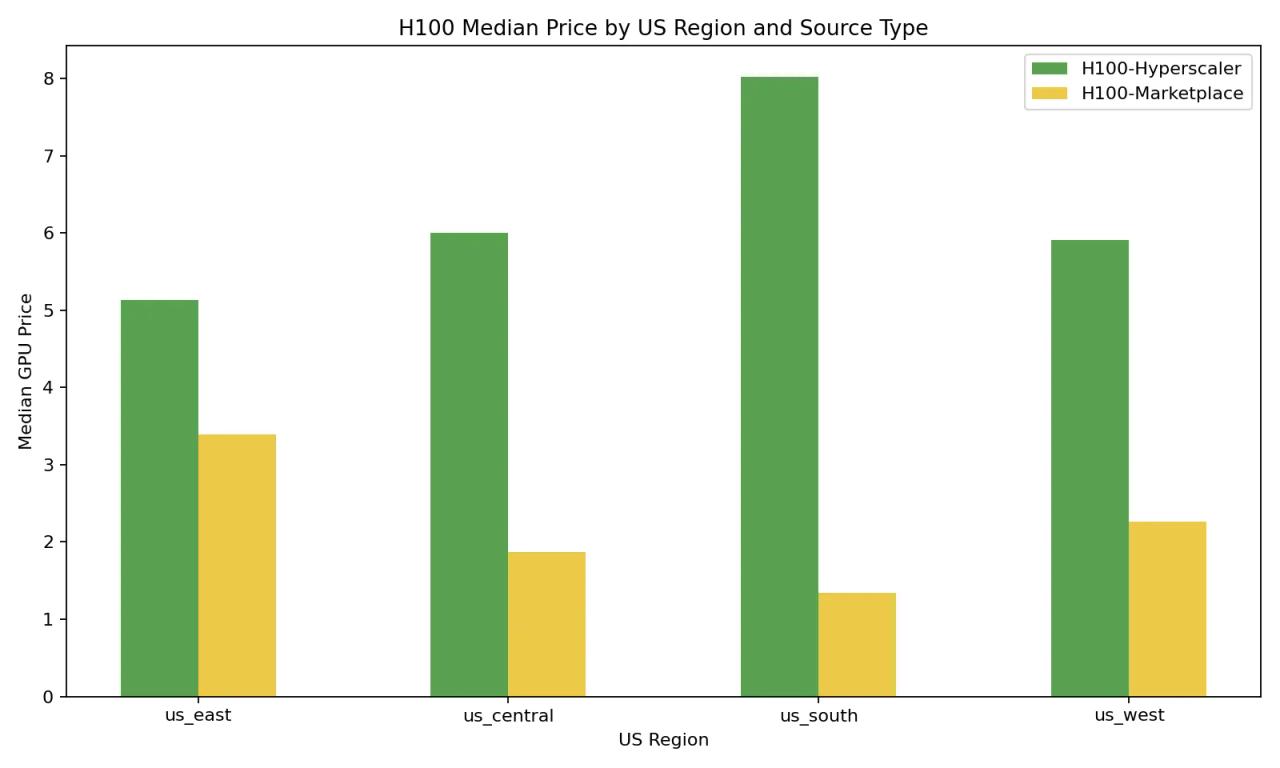
H100 Pricing: Hyperscalers Still Rule, But Marketplaces Gain Ground
The H100 market—anchored by NVIDIA’s latest-generation GPUs—remains stratified, with hyperscalers commanding significant price premiums.
Pricing Patterns:
- Hyperscalers charge 2–3× more than marketplace providers due to reservation-based capacity and enterprise-grade SLAs.
- Marketplaces show rapid growth in H100 availability, with median prices stabilizing across regions.
Notable Trends:
- US South and Central show the most aggressive pricing among marketplaces, likely driven by new compute liquidity and less saturated cloud zones.
Key Takeaway:
While hyperscalers continue to dominate H100 allocations, marketplace economics are too compelling to ignore—especially for workloads that support flexible provisioning models.
Geography Still Shapes GPU Economics
Pricing isn’t just about hardware—it reflects deep infrastructure economics like power, real estate, and latency zones. GPU prices vary sharply by where workloads are deployed.
Regional Patterns:
- US Central & South: Lowest prices overall, driven by lower energy costs and cooling-friendly environments.
- US East: Stable, mid-tier pricing tied to dense enterprise demand.
- US West: Highest costs, with proximity to AI industry HQs driving demand surges and network premium pricing.
Key Takeaway:
Location matters. Regional optimization of compute is now a core part of AI infrastructure strategy, not just a logistical afterthought.
The Shift from Scarcity to Strategy
The GPU economy has moved from an era of scarcity and scramble to one of strategic sourcing and portfolio management.
Sourcing Models Now Compete on Value:
- Hyperscalers offer global coverage and reliability—but with a growing cost premium.
- Marketplaces provide agility, cost savings, and a growing inventory of A100 and H100 hardware.
- Regional optimization emerges as a third axis, enabling organizations to reduce latency and carbon footprints while maximizing ROI.
Make Data-Driven Decisions with SiliconNavigator™
To support smarter sourcing, Silicon Data’s SiliconNavigator™ delivers unified visibility into:
- GPU specifications
- Historical and real-time pricing
- Market trends by region and provider type
This intelligence empowers procurement teams, IT strategists, and finance leaders to navigate the GPU rental market with precision—turning compute provisioning into a competitive edge.
Conclusion: Transparency, Flexibility, and Geography Define the Future
The U.S. GPU rental market is now shaped by a dynamic interplay between:
- Supply models (hyperscaler vs marketplace)
- Geographic economics
- AI infrastructure maturity
Organizations that embrace price transparency, source flexibly across regions, and use data to guide strategy will lead in AI cost-efficiency and deployment velocity.