
Silicon Index — daily GPU price benchmarks
GPU Rental Price Indices — Daily Benchmarks Across the AI Compute Market
Silicon Indices give financial institutions, AI companies, and infrastructure providers a transparent, independent view of what GPU capacity actually costs — updated every day, across neo-clouds and hyperscalers.
- 95% of neo-cloud GPU providers
- 100% of major hyperscalers
- Daily via API & partners
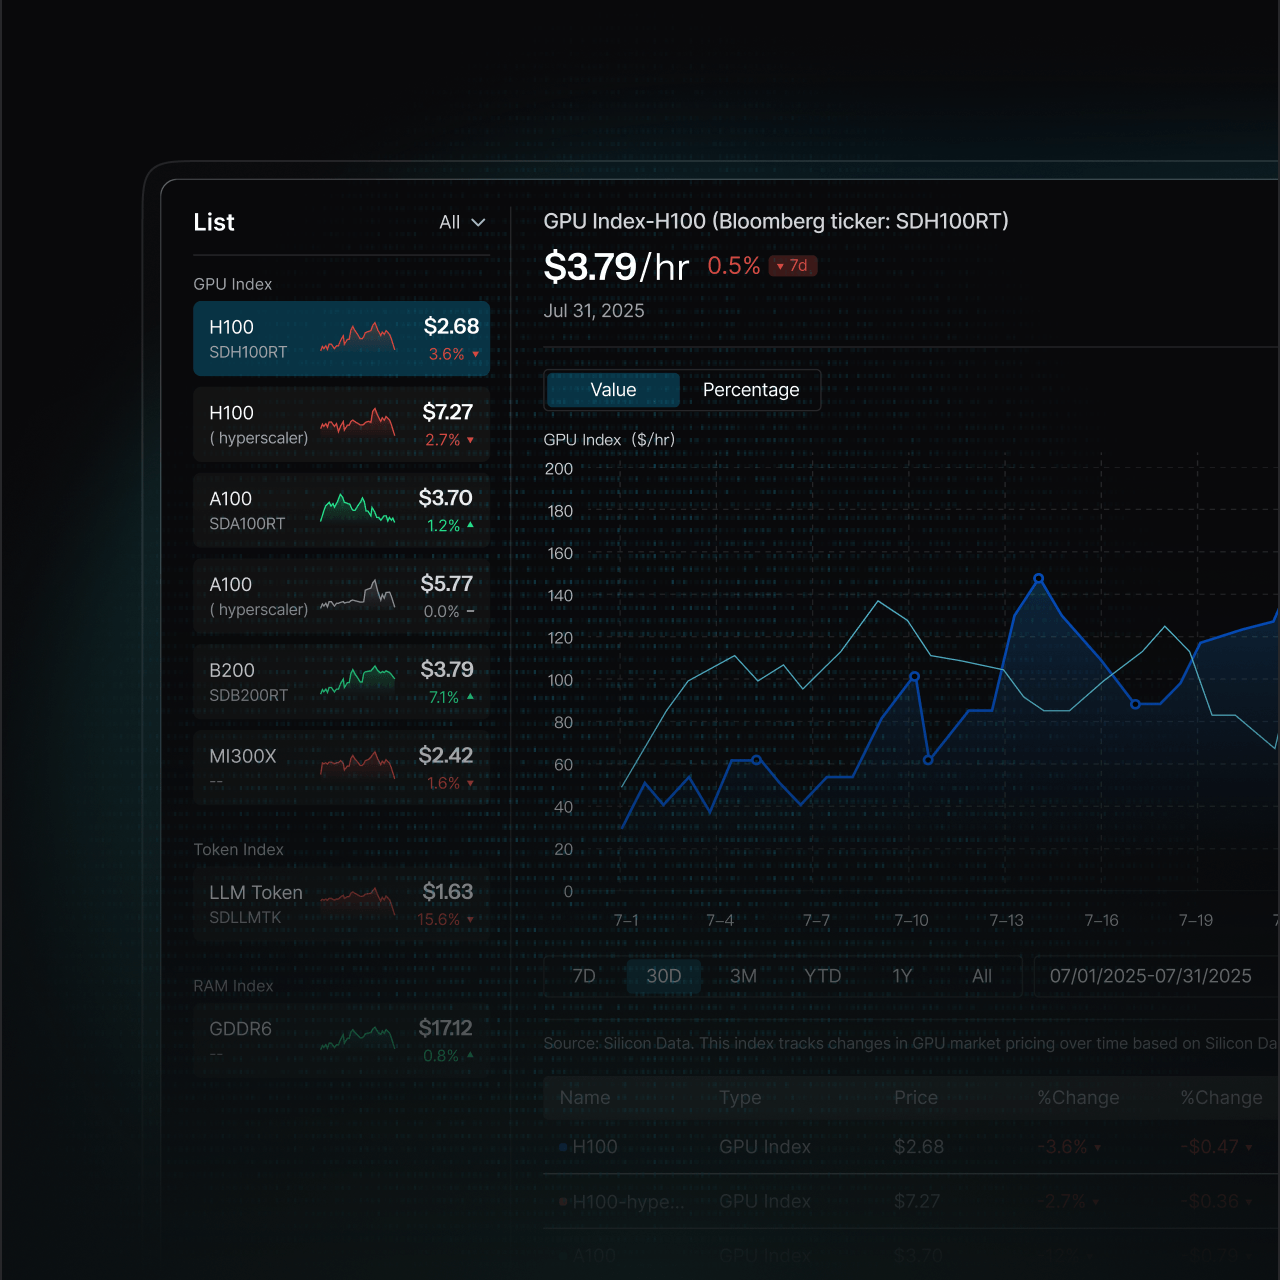
The Silicon Index family
Every Silicon Index, updated daily
GPU rental, LLM token and memory benchmarks — each reflects the full market, not a single provider's rate card.
GPU index
Token index
RAM index
Raw Data to Benchmark
Methodology
Every GPU rental record is first converted to a standardized per-hour, per-GPU rate — unit price equals total rental price divided by the number of GPUs times duration. Preprocessed data then undergoes multi-stage filtering to remove reporting errors without ignoring genuine structural price movements. Because simply aggregating prices would fluctuate with the daily mix of configurations, a basis adjustment standardizes each record to a benchmark-equivalent contract, accounting for rental type, geography, CPU platform, and GPU variant. Basis-adjusted prices are aggregated at the provider level, and the final index value is a weighted average across providers.

Coverage across the GPU rental market
The Silicon Index coverage network spans neo-cloud providers and GPU marketplaces across the rental market.

Frequently asked questions
The Silicon GPU rental price index is a family of daily benchmarks tracking hourly rental prices for specific GPU models across the full rental market. Each index represents a standardized, like-for-like price drawn from neo-cloud providers and GPU marketplaces. H100 and A100 also publish a separate hyperscaler reading.
Every index is processed and published once per business day, reflecting the latest captured rental and transaction data.
Today the family covers H100, H200, A100, B200, B300, and MI300X rental price indices, plus the LLM Token Expenditure Index — with more models added as coverage expands.
Neo-cloud and marketplace capacity typically prices below hyperscaler on-demand rates. H100 and A100 are tracked across both segments, with each reading published separately so you can see the spread and how it moves.
Via the Silicon Data portal, direct API (e.g. ticker SDH100RT), and distribution partners including Kaiko.
We aggregate real-time rental pricing from neo-cloud providers and GPU marketplaces, then standardize it into a like-for-like benchmark. Hyperscaler pricing for H100 and A100 is tracked as a separate reading.
Get access to Silicon Data
Full access to every Silicon Index, the complete portal, and historical pricing — distributed via web and API.
Silicon Data Portal Access
7-day trial
Daily GPU and LLM market intelligence, built for institutional use.
- Silicon Index™ Dashboard — all GPU, CPU & accelerator indices
- Market direction tracking
- PriceIQ predictive modeling

- Daily index values & 90-day historical pricing
- NeoCloud vs Hyperscaler comparison
- SiliconCarbon™