
GPU Residual Value
Discover The Residual Value of Compute Hardware
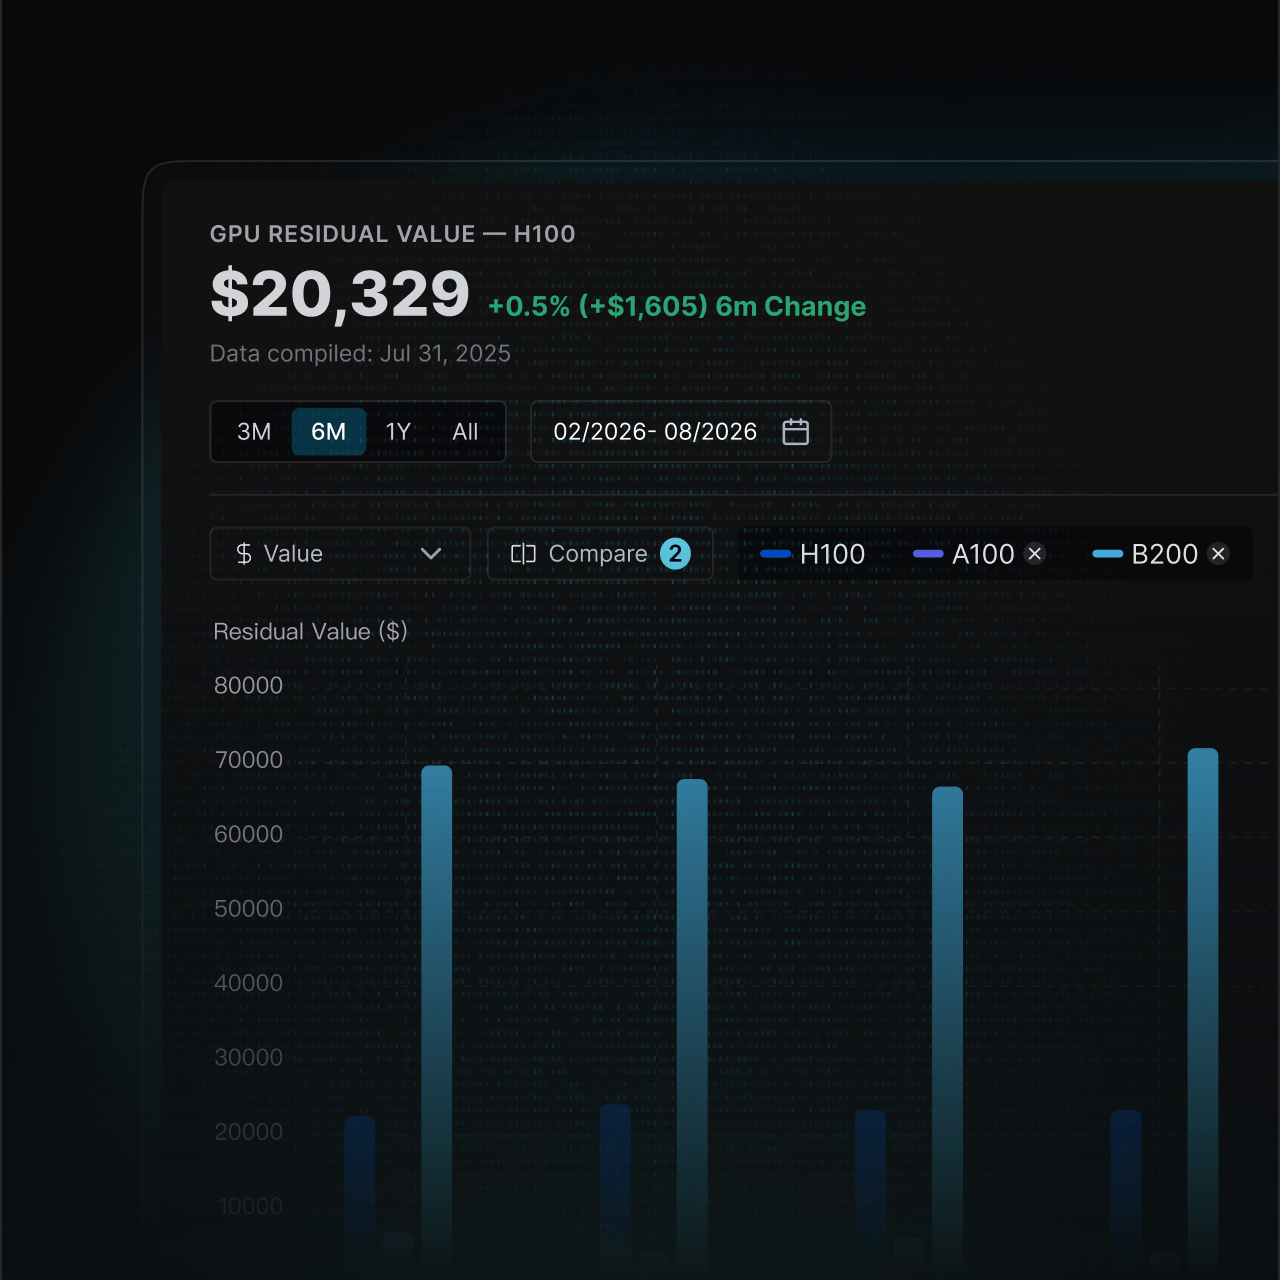
Move beyond straight-line depreciation. The GPU Residual Value calculates what your physical GPUs are worth today by projecting their real-world earning power tomorrow — a continuous DCF valuation powered by the Silicon Data GPU Forward Curve.
Why it matters
The New Standard for Hardware Valuation

Powered by the GPU Forward Curve
A GPU's true value is dictated by its future earning potential, not static accounting rules. The model ingests rental rates directly from the GPU Forward Curve, replacing theoretical depreciation with hard market data.

Data-driven lifecycle economics
Map a GPU's complete economic lifecycle — projected utilization decay against operating costs — to decide when to hold, upgrade, or liquidate, calculate true TCO, and manage fleets with market intelligence instead of guesswork.

Methodology
How the GPU residual value model works
A continuous discounted cash flow valuation over the GPU's expected useful life, measured from mass availability. At each increment of remaining life:


Market-Implied Rental Rates (Months 0–36)
Drawn directly from the 36-month Forward Curve to capture market-implied pricing dynamics.

Projected Tail Decay Rates (Beyond 36 Months)
The model holds the last observed Forward Curve rate and applies a compounding tail decay to represent continued asset depreciation.

Utilization & Interest Rate Discount
A rate combining Utilization and Interest Rates. Utilization begins at a set percentage at mass availability and gradually declines, accounting for competitive erosion from newer, faster hardware architectures.

Operating Costs
Factored in as a fixed ratio (covering electricity, rack space, labor) and deducted from gross revenue.
Rental inputs come from the GPU Forward Curve, built on the SiliconIndex™ family of daily GPU rental price benchmarks.

Frequently Asked Questions (FAQ)
A: The maximum physical operating life is a configurable parameter — currently estimated at around 8 years based on historical end-of-life data disclosed by hyperscalers (e.g., AWS, GCP) for previous GPU generations like the P100 and V100. However, the economic life is handled dynamically by our Utilization decline curve and the Forward Curve's pricing. If an architecture becomes obsolete faster than its physical lifespan, the projected utilization and rental rates will crater within the model, driving the residual value to near-zero well before the maximum parameter is reached.
A: Utilization follows a continuous exponential decay of the form k·e^(−rt), where k is current utilization, r is the decay rate, and t is time from the estimation date — not a linear drop or a step function. Generational shocks such as a Blackwell release are captured through the market side of the model: the Forward Curve's rental pricing reprices immediately, while the decay curve represents the gradual competitive erosion as newer, faster architectures absorb workloads.
A: The current model uses a blended global average operating-cost ratio covering electricity, rack space, and labor — a standardized macroeconomic baseline for valuation rather than a site-level cost model. Region-specific cost modifiers may be introduced as market data granularity improves.
A: The model holds the last observed Forward Curve rate and applies a compounding tail decay anchored to the month-36 state, with a decay rate set well above the initial curve's to reflect accelerated obsolescence of aging architectures. Because value at that point is already heavily discounted, the tail assumption adds little sensitivity to the final present value.
A: Yes. The residual value recalculates dynamically as the underlying GPU Forward Curve inputs change, so it reflects the true, real-time mark-to-market value of the asset rather than a static depreciation schedule fixed at purchase.
Get access to Silicon Data
Full access to every Silicon Index, the complete portal, and historical pricing — distributed via web and API.
Silicon Data Portal Access
7-day trial
Daily GPU and LLM market intelligence, built for institutional use.
- Silicon Index™ Dashboard — all GPU, CPU & accelerator indices
- Market direction tracking
- PriceIQ predictive modeling

- Daily index values & 90-day historical pricing
- NeoCloud vs Hyperscaler comparison
- SiliconCarbon™