
SiliconSiteIQ™
See the true commercial potential of any AI data center.
Translate facility power, climate, and hardware specs into deployable GPU power, break-even utilization, and GPU payback — for any AI data center, in minutes, not weeks.
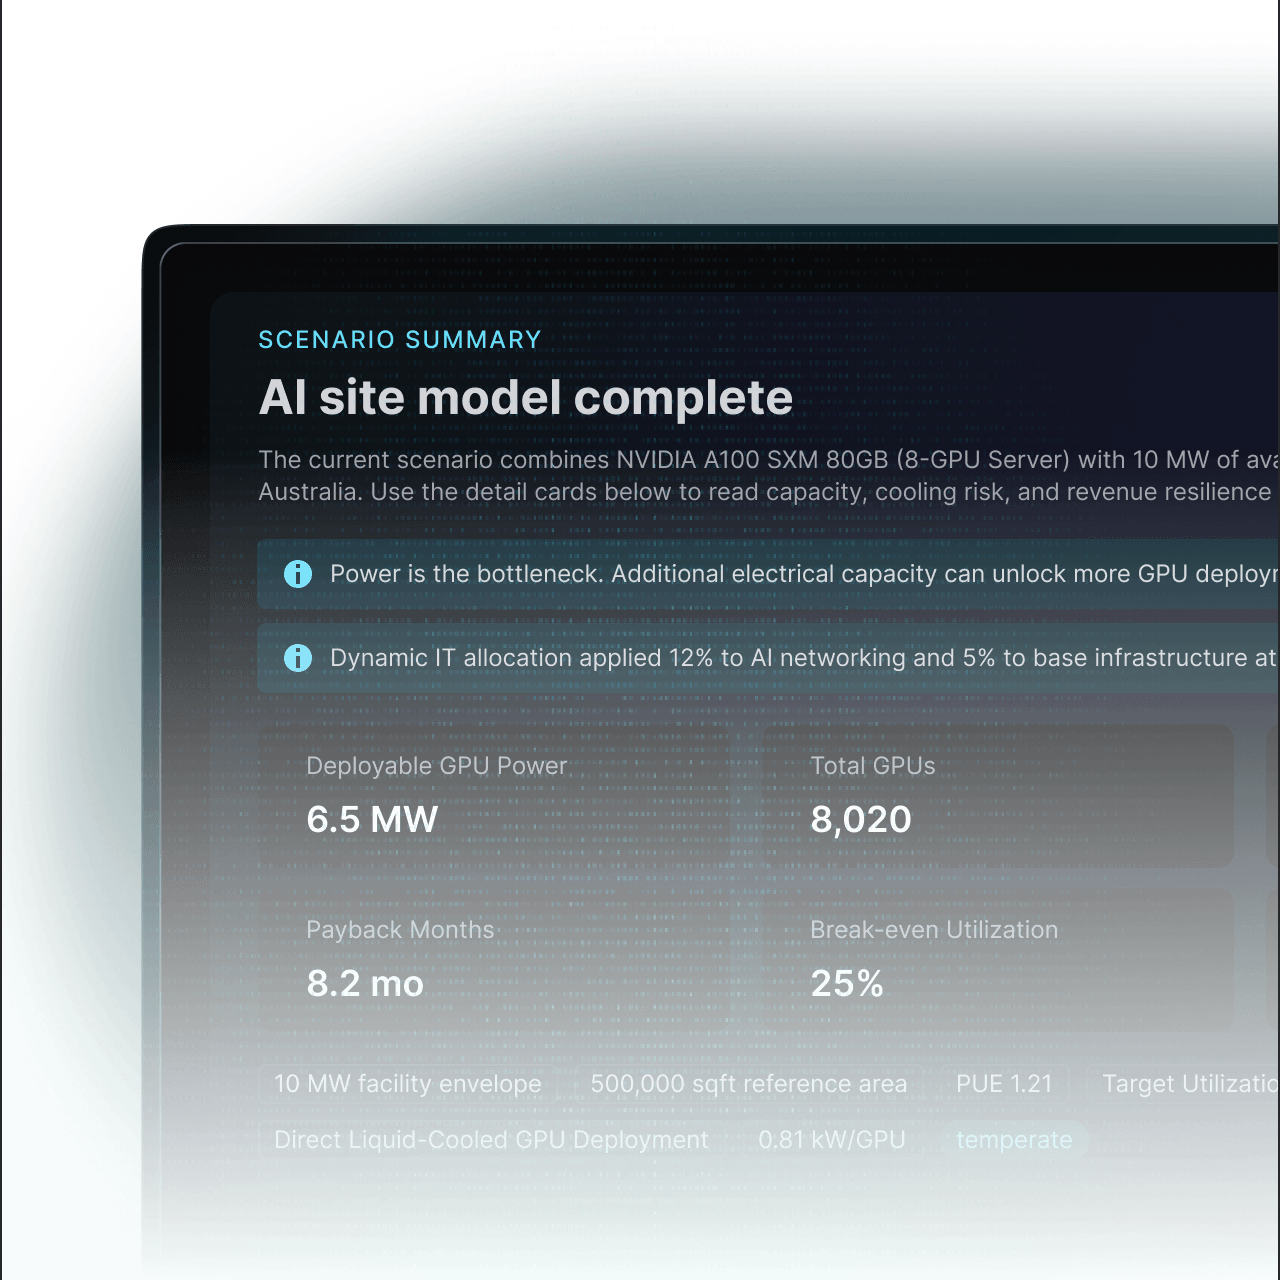
The Problem
The Megawatt Illusion is breaking AI infrastructure underwriting
Total facility power isn’t deployable compute. Traditional evaluation methods miss the power and cooling penalties of high-density AI workloads — and the gap is where deals fail.
Total facility power — the figure on the brochure.
Deployable GPU power after climate-adjusted PUE, AI networking, and base infrastructure draw.
A 35% gap closes investment theses — or kills them. SiteIQ surfaces it before capex commits, not after the first quarter of operation.
How SiteIQ works
From site envelope to underwriting decision in minutes
Configure selected site
Enter facility parameters — total power, usable space, location, and GPU preferences. SiteIQ pulls regional climate and electricity pricing data automatically.
- Total facility power (MW)
- Usable space & location
- GPU model preferences
- Cooling strategy
Run the analysis
SiteIQ calculates capacity, cooling requirements, redundancy design, and financial projections automatically — applying climate-adjusted PUE and live market data.
- Maximum deployable GPU capacity
- Cooling requirements & validation
- Climate-adjusted PUE
- Revenue, cost, and margin projection
Review results
Explore interactive dashboards with heatmaps, charts, and detailed breakdowns to guide investment or operational decisions.
- Cooling stress heatmaps
- Break-even utilization charts
- Capacity maps
- Thermal stress scoring

Who uses SiteIQ
Built for the people deploying capital and capacity

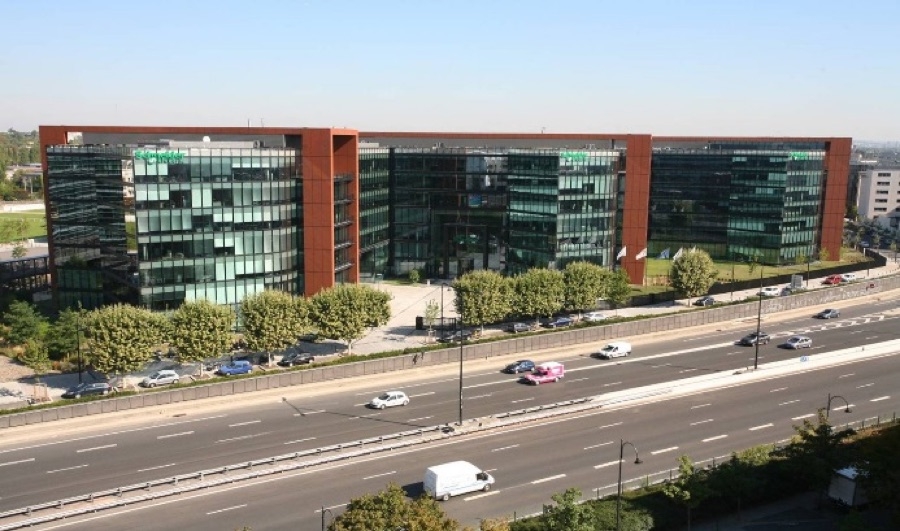
Data Center Operators
Model deployable density and thermal headroom before committing capex, and keep utilization plans grounded in real power and cooling limits.
Infrastructure & Engineering Teams
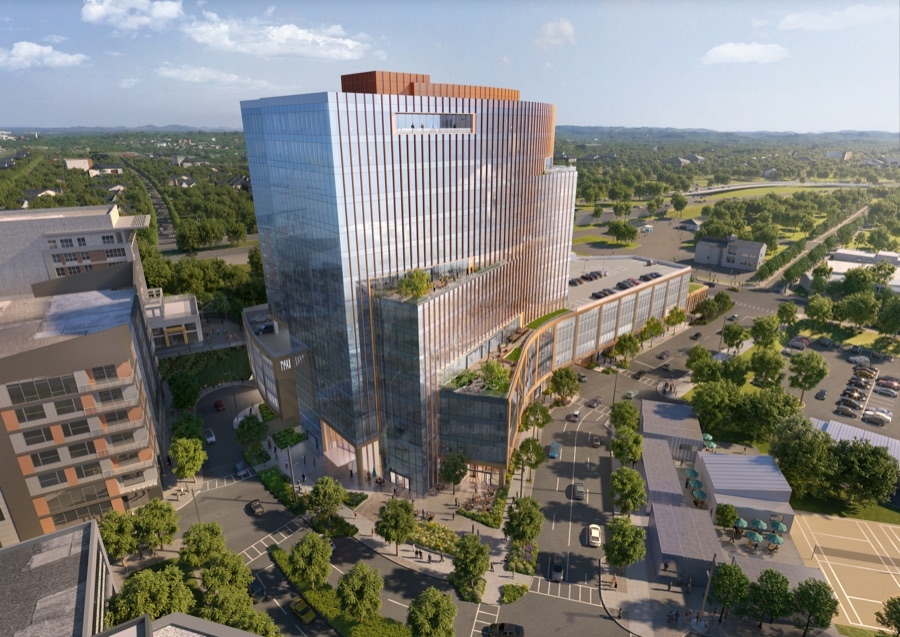
Model redundancy, thermal strategies, and deployment density across configurations. Compare air, liquid, and immersion cooling side by side, and see how AI networking and base infrastructure siphon power from core GPU compute.
Investors & Financial Analysts
Evaluate site-level profitability, break-even timelines, and revenue projections. Stress-test pro forma models against engineering reality and compare facilities on a like-for-like deployable-power basis before committing capital.
Colocation Providers
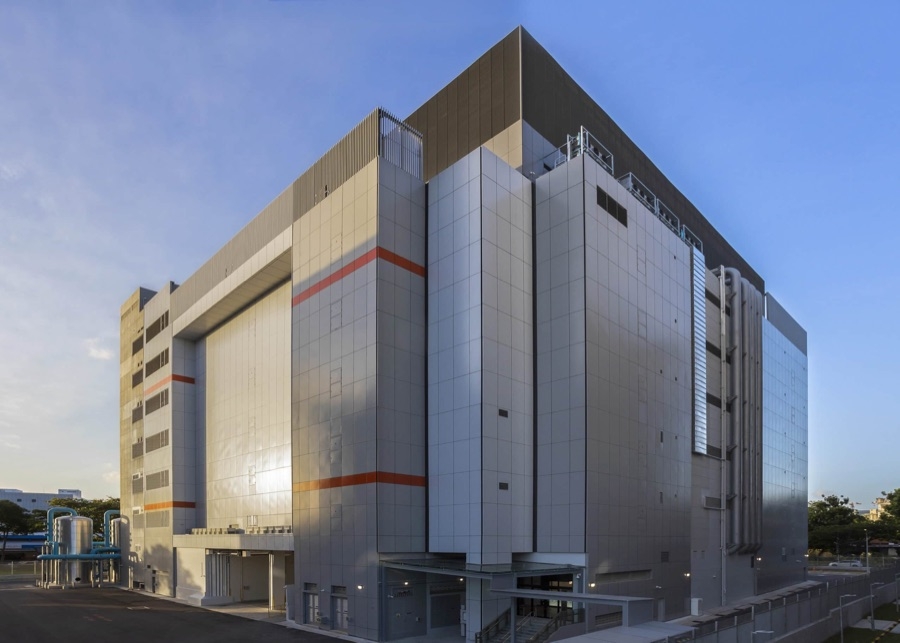
Understand how GPU workloads change power, cooling, and pricing dynamics. Reprice tenant contracts against accurate density and PUE assumptions, and identify which sites are best positioned for the AI workload mix.
Key capabilities
Everything you need to underwrite an AI data center
SiteIQ replaces six different spreadsheets, climate APIs, and price feeds with one analysis surface — built specifically for GPU-dense AI workloads.

Capacity Planning
Input facility power, usable space, and location. SiteIQ calculates maximum deployable GPU capacity after IT load, AI networking, and non-IT overhead.

GPU Analysis
Evaluate H100, A100, B200, MI300X and other GPU models with real specs — TDP, deployment density, and thermal requirements — so density assumptions match physics.

Cooling Optimization
Compare air, liquid, and immersion cooling strategies side by side. Automatic validation flags configurations that won’t sustain high-density AI workloads.

Market Transparency
Project revenue, power costs, rental pricing, and profit margins based on utilization and live market data sourced from the Silicon Index family.

Independent and Objective
Factor in regional climate, electricity pricing, and design dry-bulb/wet-bulb data to compute an effective PUE for any geography. Same site, different region — different economics.

Built for Action
Generate cooling stress heatmaps, break-even utilization charts, capacity maps, and thermal stress scoring. Outputs ready for investment memos and capacity plans.
What you’ll see
Four categories of output, one shared methodology
SiteIQ generates capacity breakdowns, financial projections, operational cost models, and climate-adjusted analytics — surfaced through interactive dashboards, cooling stress heatmaps, break-even charts, capacity maps, and thermal stress scoring. Every figure is traceable to its underlying inputs.

Capacity Breakdown
How facility power actually distributes across compute, networking, and overhead — the honest split between the brochure number and what your site can really run.
From the Capacity Analysis card

Financial Health
Revenue, margin, and payback projections that translate physical site constraints into investment-grade financial outputs, ready to paste into a memo.
From the Financial Model card

Operational Costs
Full operating cost models broken out by line item so you can stress-test each input independently and see exactly which assumption moves the answer.
From the Capacity Analysis card

Climate & Cooling
Climate-adjusted efficiency and thermal analysis keyed to the facility’s regional weather data — assumptions match the actual site, not a generic template.
From the Capacity Analysis card
Why SiteIQ
From raw engineering to a clear financial picture

Speed
Get answers in minutes instead of weeks of manual spreadsheet modeling. Scenario work that took an analyst-week now takes an analyst-coffee.

Accuracy
Built on real-world data — live electricity pricing, climate datasets, and GPU market rates piped in from the Silicon Index family.

Clarity
Interactive visualizations make complex infrastructure decisions easy to understand and easy to communicate to non-technical stakeholders.

Flexibility
Compare scenarios across locations, GPU models, and cooling strategies side by side. Stress-test before you commit capital.
Frequently Asked Questions (FAQ)
SiteIQ is a web-based AI data center capacity planning and GPU deployment underwriting platform built by Silicon Data. It translates raw facility envelopes, localized climate data, and specific hardware specifications into actionable margin projections, capacity breakdowns, and thermal stress scores. Users get analysis in minutes that previously took weeks of manual spreadsheet modeling.
The megawatt illusion is treating a facility’s total utility power as if it were deployable GPU compute. After climate-adjusted PUE, AI networking, redundancy, and base-infrastructure draw, the power that actually reaches GPUs is materially lower — often around a third less. Underwriting against the headline megawatt number overstates capacity and margins.
SiteIQ models H100, A100, B200, MI300X and other data-center GPUs with real specifications — TDP, deployment density, and thermal requirements — so density assumptions match physics rather than nameplate figures.
It factors regional climate, design dry-bulb/wet-bulb temperatures, electricity pricing, and the chosen cooling strategy (air, liquid, or immersion) to compute an effective PUE for the specific geography — so the same site in a different region yields different economics.
Capacity breakdowns, financial projections, operational cost models, and climate-adjusted analytics — surfaced through interactive dashboards, cooling stress heatmaps, break-even utilization charts, capacity maps, and thermal stress scoring. Every figure is traceable to its inputs.
SiteIQ is available through Silicon Data portal access. Talk to sales for institutional and team plans.
Get access to Silicon Data
Full access to every Silicon Index, the complete portal, and historical pricing — distributed via web and API.
Silicon Data Portal Access
7-day trial →Daily GPU and LLM market intelligence, built for institutional use.
- SiliconIndex™ Dashboard — all GPU, Memory & accelerator indices
- Market direction tracking
- PriceIQ predictive modeling
- Daily index values & 90-day historical pricing
- NeoCloud vs Hyperscaler comparison
- SiliconCarbon™