
The Crunch Spread: GPU Rents and Token Prices Are Pulling Apart (Part 1)
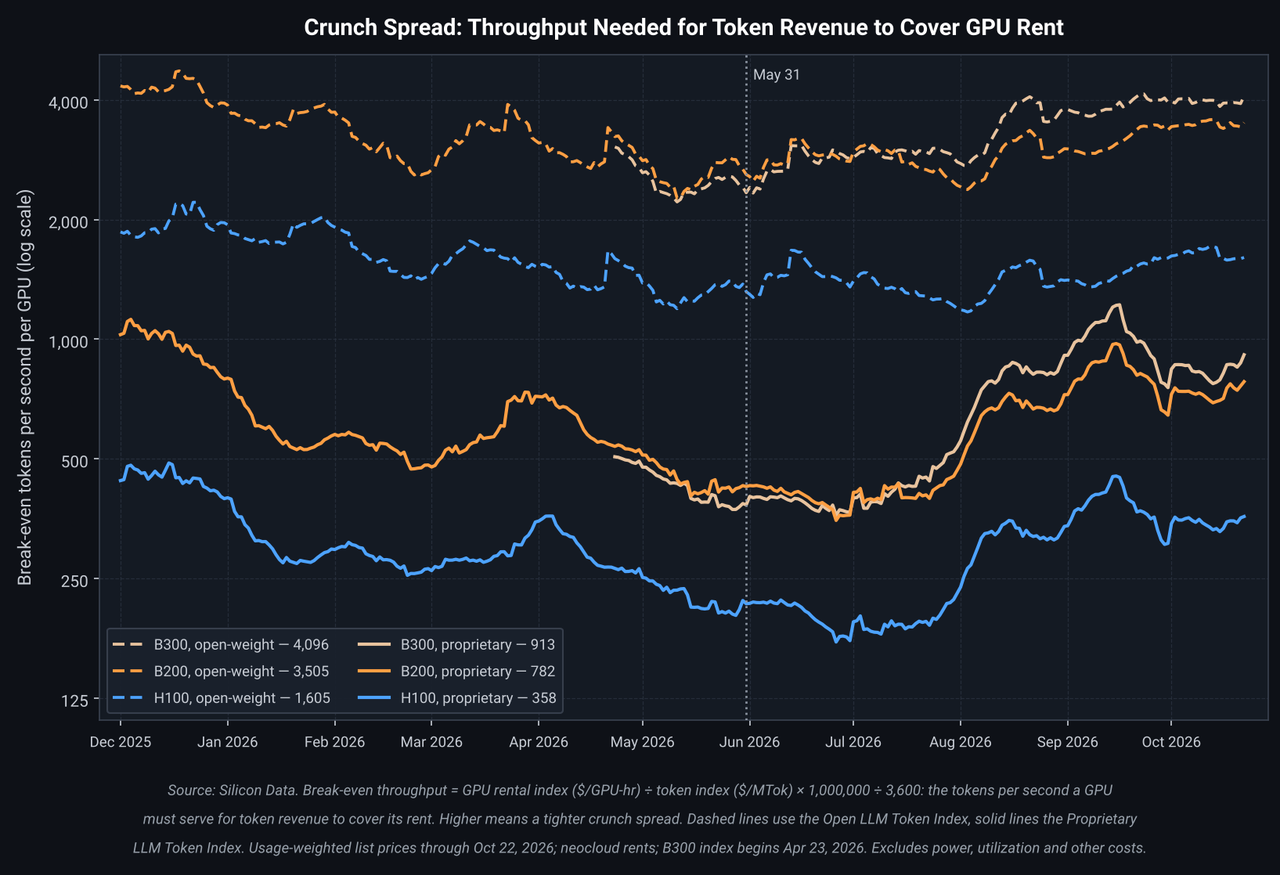
GPU rents are rising and token prices are falling. We measure the crunch spread as break-even throughput: the tokens per second a GPU must serve to cover its rent.

Crunch spread, part 1 · H100 · B200 · B300 · Dec 1, 2025 to Oct 22, 2026
Commodity markets price processing margins as spreads. The crack spread is refined products minus crude; the crush spread is soybean meal and oil minus soybeans. AI compute has the same structure. A GPU is the input, tokens are the output, and the gap between what tokens earn and what the GPU costs is the margin of turning one into the other. Don Wilson of DRW coined a name for it: "the crunch spread." Refiners watch the crack spread to decide whether to add capacity. The crunch spread plays the same role for the AI buildout: it measures what the tokens a GPU produces earn against what the GPU costs to rent, and so whether the compute being built today can pay for itself. Silicon Data publishes both legs every day, in our neocloud GPU rental indices and our LLM token indices.
This note sets out how we measure the crunch spread from those two legs and what has moved it since December. A follow-up note will set the result against the throughput GPUs actually achieve on specific models.
Key takeaways
- The hurdle has risen on every chip. Since May 31, the throughput a GPU needs to cover its rent is up 22% to 75% against open-weight token prices and 66% to 139% against proprietary ones.
- On the newest chips, rent leads. B300 rent is up 52% since May 31, about three-quarters of its rise on the open-weight basis. On H100, where rent rose 5.5%, falling token prices do most of the work.
- Frontier price cuts squeezed the proprietary basis hardest. Our proprietary token index fell 36% over the same period, against 13% for open-weight models. Part of that is cheaper successor models, not cuts to existing ones.
Terms used in this note
- Crunch spread: Token revenue per GPU-hour minus GPU rent per hour. A wider spread means more margin for whoever runs the GPU.
- Break-even throughput: The tokens per second a GPU must serve for token revenue to equal its rent. A rise means the spread is tightening unless throughput keeps up.
- LLM token indices: Silicon Data's daily price of one million LLM tokens for open-weight and proprietary models, each model weighted by the tokens it serves.
- Open-weight and proprietary: Open-weight models publish their weights. Many inference providers serve them. Proprietary models are served mainly by the labs that build them.
- Neocloud: A GPU cloud provider other than the hyperscalers (AWS, Microsoft Azure, Google Cloud and Oracle). Our rental indices cover neoclouds.
- Throughput: Tokens a GPU serves per second. It varies by chip, model, workload, per-user speed and serving software.
How we measure it: break-even throughput
A token price is quoted per million tokens and a GPU rent per hour. Turning one into the other needs a throughput, and throughput is not one number. So we turn the question around and publish the hurdle: how many tokens per second a GPU must serve to cover its rent.
Break-even throughput (tokens/s per GPU) = GPU rent ($/GPU-hour) ÷ token price ($/million tokens) × 1,000,000 ÷ 3,600
Anyone running GPUs can set this against what their own hardware and models achieve. Because it is a ratio of the two legs, its change splits exactly into a rent part and a token-price part, which is what the rest of this note uses.
Rents up, token prices down
| Measure | May 31 | Oct 22 | Change |
|---|---|---|---|
| B300 rent (per GPU-hour) | $4.84 | $7.35 | +51.9% |
| H100 rent (per GPU-hour) | $2.73 | $2.88 | +5.5% |
| Open-weight token index (per million tokens) | $0.58 | $0.50 | −13.4% |
| Proprietary token index (per million tokens) | $3.51 | $2.24 | −36.3% |
Since the end of May, the two legs of the spread have moved in opposite directions. Rents rose on every chip, most on the newest, while token prices fell, most for proprietary models. Break-even throughput has risen on every chip and both bases as a result. May 31 is near the low point for break-evens, which flatters the size of the rise.
| Basis | Chip | Break-even, Oct 22 (tokens/s) | Change since May 31 | Rent change | Token price change | Share of move from rent |
|---|---|---|---|---|---|---|
| Open-weight | B300 | 4,096 | +75.4% | +51.9% | −13.4% | 74% |
| Open-weight | B200 | 3,505 | +35.0% | +16.9% | −13.4% | 52% |
| Open-weight | H100 | 1,605 | +21.9% | +5.5% | −13.4% | 27% |
| Proprietary | B300 | 913 | +138.5% | +51.9% | −36.3% | 48% |
| Proprietary | B200 | 782 | +83.7% | +16.9% | −36.3% | 26% |
| Proprietary | H100 | 358 | +65.7% | +5.5% | −36.3% | 11% |
Two bases, two stories
Open-weight: the neocloud spread
Open-weight tokens are largely served by inference providers renting neocloud GPUs, so this basis is the closest match to the rents our indices price. Every chip faced the same 13% fall in open-weight token prices; what separates them is rent. On B300, rent explains about three-quarters of the higher hurdle, on B200 about half and on H100 about a quarter. The tightening is coming mostly from what renters pay for the newest chips, not from what their tokens earn.
Proprietary: the frontier price war
Proprietary prices fell nearly three times as much as open-weight prices, so on this basis falling token prices drive most of the rise, except on B300, where rent and price contribute about equally. The index is weighted by usage, so its fall includes cheaper successor models and usage moving to them, not only cuts to existing models. Proprietary tokens also run mostly on lab and hyperscaler capacity that our rental indices do not price. Read this basis as the throughput a neocloud GPU would need if it earned frontier-model prices: a measure of how much the price war has raised the bar, not of the labs' own margins.
Falling frontier prices have three possible explanations: cost savings passed on, prices set ahead of expected efficiency gains, or competition compressing margins. Each raises this hurdle in the same way. Telling them apart needs the timing of each price cut against model releases and the labs' margins over time, which a later note takes up.
Compare the two bases by their changes, not their levels. Proprietary models are generally larger and serve fewer tokens per second per GPU, so a lower break-even does not mean an easier hurdle.
We do not use the all-models token index here. Usage has shifted heavily toward open-weight models, from about 16% of token volume in December to about 74% in October on our estimates, and a usage-weighted index records that shift as a falling price. All-models break-evens rose 127% to 226% since May 31, mostly for that reason rather than because of rents or price cuts.
List prices and rent only. Break-even throughput uses posted token prices and neocloud GPU rents. It excludes power, utilization, networking and every other cost, and it is a hurdle, not a margin estimate.
What this does not tell you, and what comes next
Whether the spread is actually tightening. A rising hurdle is a squeeze only if achieved throughput lags it. Throughput varies several times over by chip, model and serving software, and it has been rising fast. Our next note measures the spread itself on specific open-weight models, setting achieved throughput against these hurdles, drawing on benchmark data from our work with Artificial Analysis.
Whether the B300 premium is earned. Renters are paying 52% more for B300 than in May. If the newest chips serve that many more tokens per second, the premium is the market pricing their productivity; if not, B300 renters are squeezed.
Where frontier prices go next. If the proprietary price declines continue, the bar on that basis keeps rising; whether that pressures frontier margins depends on how much of it comes from cheaper, faster successor models.
Method and sources
Method. Break-even throughput is the daily Silicon Data neocloud rental index for each GPU, in USD per GPU-hour, divided by the Open or Proprietary LLM Token Index in USD per million tokens, times 1,000,000 ÷ 3,600. Data run from Dec 1, 2025 to Oct 22, 2026; the B300 index begins Apr 23, 2026. The token indices weight each model by the tokens it serves, so each is total spending divided by total tokens: the average price a token earns, which is the price relevant to a GPU paid per token. The share of the move from rent is the log change in rent divided by the log change in break-even throughput; the token-price share is the remainder. The open-weight share of token volume solves all-models = share × open-weight + (1 − share) × proprietary each day and is approximate, because the indices use separate baskets.
Reading the chart. The chart uses a log scale, so equal vertical distances are equal percentage changes.
Sources. Silicon Data neocloud GPU rental indices and LLM token indices; Don Wilson, post introducing the term "crunch spread".
Frequently Asked Questions
Token revenue per GPU-hour minus GPU rent per hour. A wider spread means more margin for whoever runs the GPU. Don Wilson of DRW coined the name, after the crack spread in oil and the crush spread in soybeans.
Break-even throughput (tokens/s per GPU) = GPU rent ($/GPU-hour) ÷ token price ($/million tokens) × 1,000,000 ÷ 3,600. It is the tokens per second a GPU must serve for token revenue to equal its rent.
Usage has shifted heavily toward open-weight models, from about 16% of token volume in December to about 74% in October on our estimates, and a usage-weighted index records that shift as a falling price. All-models break-evens rose 127% to 226% since May 31, mostly for that reason.