
H200 vs H100 Rental Prices, May to July 2026: The Premium That Doubled
Twelve weeks of daily data on the H200 and H100 Neo-Cloud indices: the H200 rose 14.4%, the H100 7.0%, and the premium between them ran from 5% to 0.4% to a 16.2% peak.

The H200 Neo-Cloud rate opened May at $2.70 per GPU-hour. On July 27 it stood at $3.09, a 14.4% rise over twelve weeks, with a series high of $3.10 on July 18. The H100 Neo-Cloud rate rose too, but half as much and all of it early: $2.57 on May 4, $2.73 by the end of May, and $2.75 on July 27 after a June round trip.
Two chips, one tier, twelve weeks, and a spread that ran from 5% to a low of 0.4% to a peak of 16.2%. The premium is the story.
Our H200 Neo-Cloud Index was announced on June 30, 2026 and became effective July 15, joining the H100, A100, B200, and MI300X series in the index family, with official daily history starting May 4, 2026 per the index announcement record. This is the first review of what that history shows.
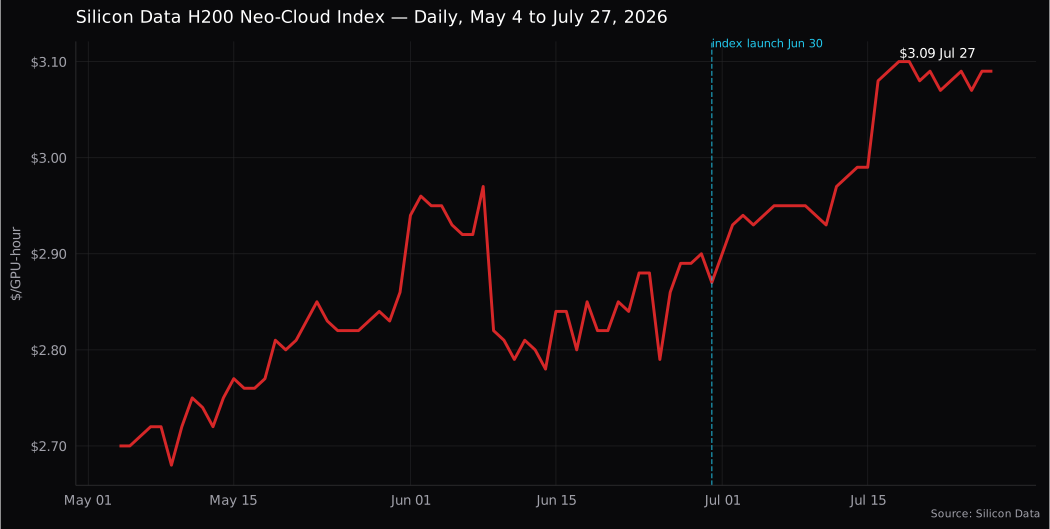
Twelve Weeks of the H200 Neo-Cloud Index
May was a quiet grind higher. The rate entered the month at $2.70, touched its series low of $2.68 on May 9, and closed the month at $2.86, with no single-day move larger than a few cents.
June was where the series showed its character. The month opened with a 2.8% jump to $2.94, ran to $2.97, then gave it all back in the sharpest move of the window, a 5.1% single-day drop to $2.82 on June 9. A second leg down to $2.79 on June 25 was followed by an immediate 2.5% recovery, and the month closed at $2.87, essentially flat against May's close after a round trip through both extremes.
July has been the decisive month: $2.90 on July 1 to $3.09 on July 27, a 6.6% rise with only one day of meaningful give-back, the steadiest directional stretch in the series so far.
Across the full window, annualized volatility runs 17.4%, with 17 of 84 trading days unchanged. That profile sits where a young Neo-Cloud series would be expected to sit: an order of magnitude livelier than the hyperscaler tier, directional rather than noisy.
The H100 Relation
The more interesting chart is the relative one, and with daily data on both series, the spread can be tracked day by day rather than at reference points.
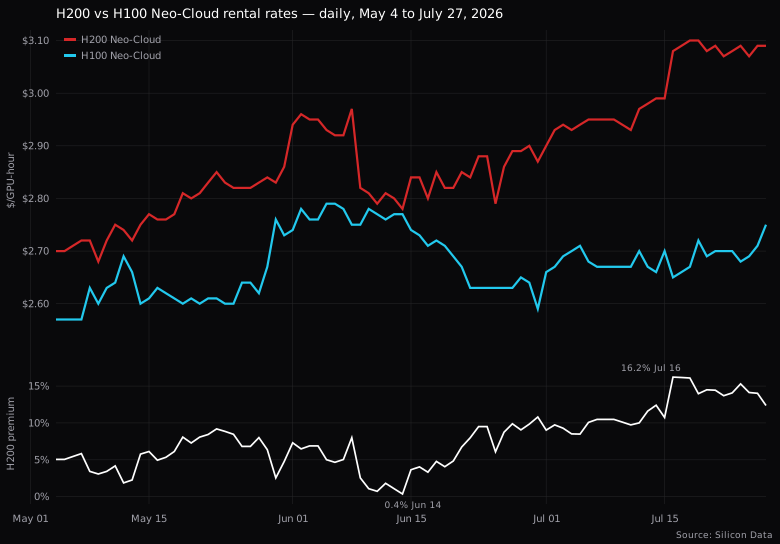
Through May the premium was steady and small: the H200 rented 5 to 6% above the H100 Neo-Cloud rate essentially all month, averaging 5.8%, for a chip with 141 GB of HBM3e against the H100's 80 GB. The direction of the spread is what the hardware would predict: the H200 is the H100's memory-upgraded successor on the same Hopper architecture, so the open question was never whether it should rent at a premium but how large the premium should be.
June compressed it to nothing. The H100 ran to its series high of $2.79 on June 5 just as the H200 was chopping lower, and on June 14 the spread touched 0.4%: for a day, the two chips rented for the same money. The compression did not hold. The H100 faded through late June to $2.59 while the H200 recovered, and the premium ended June near 11%.
July re-rated the pair. The H200 pushed to its highs while the H100 recovered only part of its June decline, and the premium averaged 12.1% for the month, peaking at 16.2% on July 16 and closing the window at 12.4%. The widening since mid-June came from both directions at first, an H100 fading and an H200 rising, and then mostly from the H200 side as the H100 stabilized.
Read against the hardware, the near-parity of mid-June looks like the anomaly and the current spread like normalization. The H200 carries 76% more memory and materially higher bandwidth, the binding resource for large-model inference. In application terms that means larger models and longer context windows served from a single GPU, more room for the KV cache that high-concurrency serving consumes, and faster memory-bound decoding, while compute-bound training gains less. A rental market pricing that advantage at 5% was arguably not pricing it at all. A repricing toward the mid-teens is consistent with memory-bound inference demand asserting itself in the rental market, though the series is young enough that provider composition and supply mix could account for part of the move.
For the longer arc of the H100 series, see our review of H100 rental prices over time.
What the Premium Does and Does Not Establish
Twelve weeks of daily data on both series establish the direction and the size of the move: the H200 Neo-Cloud rate rose 14.4%, the H100 rate rose 7.0% with a June round trip, and the daily premium between them ran from 5% to 0.4% to 16.2%, averaging 5.8% in May and 12.1% in July. That much is measured.
What the data does not establish is the mechanism. A widening premium is consistent with memory-bound demand favoring the newer chip, but a young index can also widen as its provider panel matures, and quarterly context is still thin with under three months of history. The mid-June compression in particular admits more than one reading, an H100 demand spike, an H200 supply bulge, or panel effects, and the series alone does not distinguish them. Daily changes in the two series are essentially uncorrelated over the window (correlation -0.02 on daily changes, 0.00 on weekly changes across 12 weeks), so co-movement claims are not yet supported; for now the premium is a story about levels, not about the two rates moving together. These caveats will resolve on their own as the history accumulates.
Conclusion
The first twelve weeks of the H200 Neo-Cloud Index record a chip finding its price: a premium over the H100 that spent May in the mid-single digits, collapsed to nothing for a day in mid-June, and settled into double digits through July, on rising rates rather than a falling comparator. The H100 spent the same window trading a narrow range around a settled level. The daily series for both is published on our index pages, and the spread between them is now a number worth watching monthly.
Source: Silicon Data. Daily H200 and H100 Neo-Cloud index values, May 4 to July 27, 2026. Premium computed as the daily ratio of the two series.
Frequently Asked Questions
On the Neo-Cloud tier, the H200 rental price per hour ran from $2.68 to $3.10 between early May and late July 2026, ending the window at $3.09 per GPU-hour. Hyperscaler H200 rates are not covered by this series.
Yes, and increasingly so. The daily H200 premium over the H100 averaged 5.8% in May 2026, touched 0.4% in mid-June, and averaged 12.1% in July, peaking at 16.2%. Both rates rose over the window; the H200 rose roughly twice as much.
The H200 carries 141 GB of HBM3e memory against the H100's 80 GB, with higher bandwidth, which matters most for large-model inference. In practice the advantage concentrates in inference: larger models and longer contexts fit on one GPU, and memory-bandwidth-bound decoding runs faster, while compute-bound training gains less. A double-digit premium is consistent with the market pricing that memory advantage, though the young series leaves room for other explanations.
A daily H200 rental price index for the Neo-Cloud tier: a benchmark of on-demand rates from Silicon Data, announced June 30, 2026 and effective July 15, with official daily history from May 4, 2026. It joins the H100, A100, B200, and MI300X rental index family.
July was the strongest month in the series, up 6.6% with the steadiest directional run of the twelve weeks. Whether that continues is not something three months of data can establish.