H100 Hyperscaler Index, April 2026: A Benchmark in Flat Mode
H100 Hyperscaler on-demand rates held flat from Mar 1–Apr 20, 2026, with a 0.47% coefficient of variation.

The market that didn't move
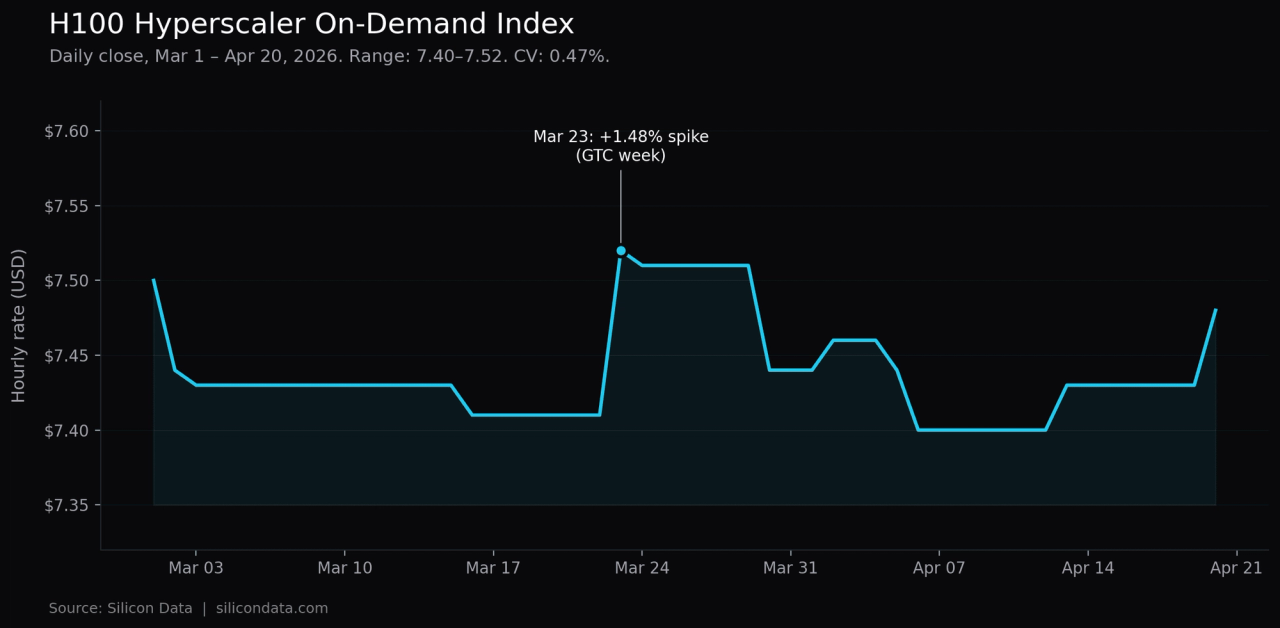
Between March 1 and April 20, 2026, Silicon Data's H100 Hyperscaler On-Demand Index traded in a band of $7.40 to $7.52. The index was unchanged on 39 of 50 daily transitions. Net change over the full seven weeks: −0.27%. Coefficient of variation: 0.47%.
For a GPU rental benchmark that tracks the most-deployed AI training chip in the world, those numbers describe a tier of the market where supply and demand are clearing quietly — with one important caveat we return to below.
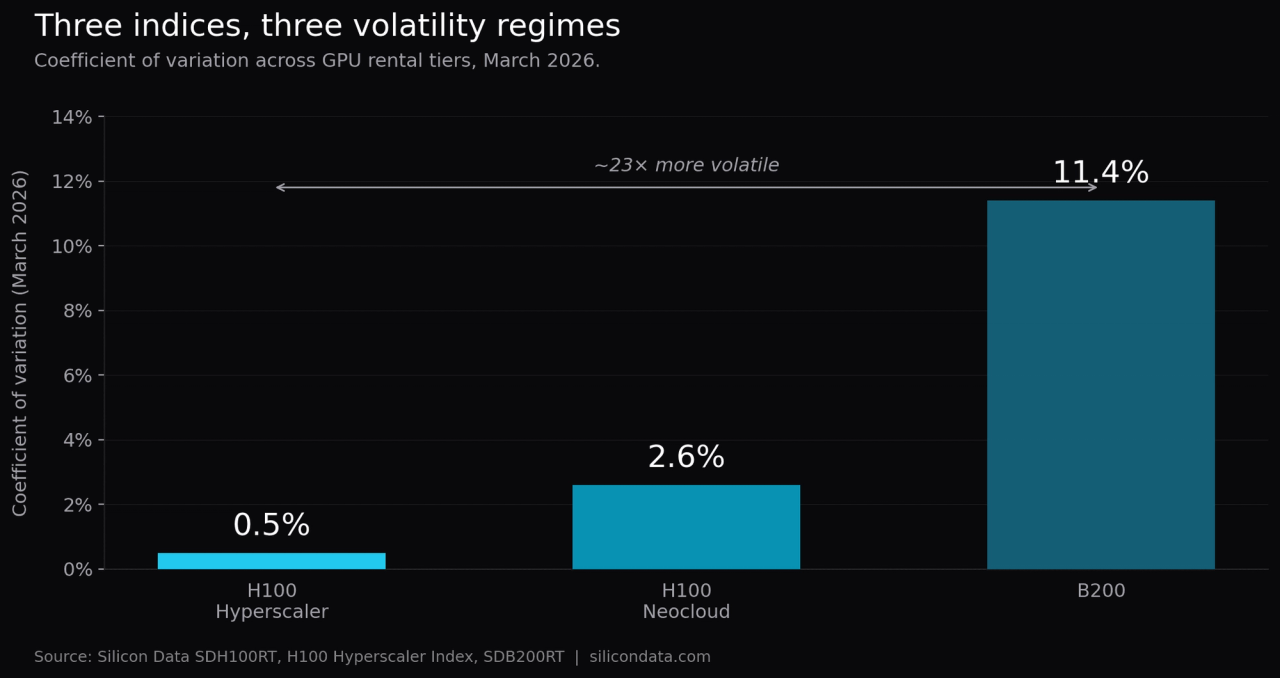
The contrast with the rest of the compute market is what makes this worth writing down. Across the same window, B200 rental pricing surged 24%, spiked above $6.00/hr in the final week of March, and posted a coefficient of variation more than twenty times higher. The H100 Neocloud tier, tracked by Silicon Data's SDH100RT index, moved more than Hyperscaler too, reflecting the competitive pressure among smaller providers. Meanwhile the enterprise-SLA H100 market sat still.
That divergence is not an accident of the calendar. It is what a mature tier of a compute market looks like when the supply side is anchored to long-dated capacity commitments and the demand side has a well-understood cost curve. The question worth asking is not why H100 Hyperscaler was quiet. The question is what that quiet makes possible.
The data in plain numbers
| Metric | Value |
|---|---|
| Period | Mar 1 – Apr 20, 2026 (50 trading days) |
| Open | $7.50 |
| Close | $7.48 |
| Net change | −$0.02 (−0.27%) |
| High / Low | $7.52 / $7.40 |
| Mean | $7.439 |
| Standard deviation | $0.035 |
| Coefficient of variation | 0.47% |
| Days unchanged | 39 of 50 (78%) |
| Largest single-day move | +$0.11 (Mar 23) |
The Mar 23 move — from $7.41 to $7.52, a +1.48% single-day jump — is the one exception that proves the rule. It lined up with the second week of NVIDIA GTC and the same demand pulse that drove B200 pricing sharply higher. On H100 Hyperscaler, the spike did not persist. By March 30 the index was back to $7.44, within $0.03 of where it started the month. By mid-April it had drifted to a new low of $7.40, then recovered to $7.48 by April 20.
The 1.48% single-day spike during NVIDIA GTC highlights a crucial characteristic of this index: while its baseline volatility is exceptionally low (0.47% CV), it remains susceptible to acute, event-driven demand shocks. Financial products, particularly parametric triggers, must be structured to account for these specific tail-risk events rather than relying purely on the baseline average
Why Hyperscaler H100 behaves like a reference rate
The stability has a clean structural explanation, and it is worth being explicit about because the same structure is what makes the index useful for institutional applications.
Supply is contracted, not spot. The H100 Hyperscaler tier is dominated by enterprise reservations — committed-use discounts, multi-year capacity agreements, and reserved instances priced against published on-demand rates. When a hyperscaler lists an on-demand H100 hourly rate, it is not clearing a spot market. It is posting a ceiling above a large book of already-priced reserved capacity. That ceiling moves slowly because the book beneath it is slow to turn.
The marginal workload on this tier is switching-cost-constrained. Enterprise AI teams running H100 Hyperscaler workloads are typically committed for the duration of a training run, a fine-tuning cycle, or an inference deployment, and the switching cost — data egress, pipeline reconfiguration, MLOps retooling, compliance re-certification — exceeds the saving from a small price change. That is why Hyperscaler demand does not react to a 2% daily rate move the way Neocloud demand does. It is important to be precise about what this claim is and is not: demand on this tier is less elastic than on Neocloud, not inelastic. The 3× Hyperscaler-to-Neocloud premium that persists through this entire window is itself evidence that some workloads continue to weigh the two tiers and choose Hyperscaler for non-price reasons. The workloads that remain are the ones for which the premium is worth paying — which is why the residual demand is slow-moving, not because demand in aggregate is indifferent to price.
The chip is two years into its commercial lifecycle. H100 pricing has been normalizing steadily since early 2024. Supply is well-understood: hyperscalers know their installed base, buyers know what they can procure, and the forward trajectory is priced into reservation economics. The excitement has moved to B200. Maturity is what is left behind.
Put together: a mature chip, contracted supply, workload-locked demand. That is the exact combination that produces the kind of rate series financial institutions recognize as benchmark-grade.
What the volatility profile supports — and what it does not
The right reading of this data is narrower than "H100 Hyperscaler is now benchmark-grade." Fifty trading days is too short a window to settle that question — credit models span 12 to 24 months, and seven weeks of low realized volatility does not establish a regime that long. Just as important, the Hyperscaler index is structurally a price ceiling that major hyperscalers maintain above their reserved-capacity book, not a cleared spot market. Its stability is administrative as much as market-derived. Any application that treats it otherwise is miscategorizing the underlying.
What the data does support is a more targeted set of use cases.
What the data supports today.
- Structured enterprise reservation pricing. This is where the Hyperscaler index does real work. Procurement, FinOps, and vendor-relations teams negotiating multi-year committed-use agreements or reserved-instance packages can reference the index as a stable ceiling benchmark — anchoring reservation discount spreads, validating vendor quotes, and setting internal budget assumptions. The realized stability of the ceiling is informative precisely because reservation contracts price off published on-demand rates.
- Stress-testing existing credit models as an overlay. Credit teams can layer observed H100 Hyperscaler volatility on top of their existing base-case revenue assumptions to tighten or widen stress bands — not to replace the base case. A ±2σ band of $0.14 is a useful sensitivity anchor for scenario analysis, not a forecast.
- Sizing parametric triggers with event carve-outs. A policy triggered by the index deviating more than 5% from a contracted expectation is pricable in principle, but the Mar 23 spike is precisely the kind of event such a policy needs to contemplate. Triggers need to specify whether conference-window moves count, or carry event carve-outs similar to those used in other commodity parametric products.
What the data does not support.
- Swap and forward pricing off this index as a trading benchmark. The Hyperscaler index is a ceiling, not a cleared spot mark. Using it as the underlying for a cleared swap or forward contract is a conceptual mismatch — the stability of a ceiling rate does not translate into tight basis for a product that settles against actual rental clearing. For swap and forward pricing of GPU rental exposure, the no-arbitrage forward rate and the Neocloud spot index are the more natural references.
- Primary inputs to multi-year credit covenants. Using seven weeks of observed volatility as the input to a 24-month debt covenant is a statistical overreach. The relevant volatility for a 24-month horizon is multi-year realized volatility, not a seven-week window. Until the index has more history, it is more honestly used as one input among several — not a standalone benchmark for long-dated underwriting.
- Cleared settlement for long-dated derivatives. Clearinghouses typically require benchmark history measured in years, not weeks, before accepting a rate as a settlement reference. The index has candidate properties. The track record is still accumulating.
- Blanket claims about event robustness. The Mar 23 move shows that a single industry conference can move this rate by several times its normal daily standard deviation. Any product or model that assumes continuous low volatility without an event risk premium is underpricing that risk. The correct inference is that this tier is stable between events and shock-sensitive at them — narrower than "behaves like a money-market rate."
For background on why these distinctions matter in compute financialization specifically, see Yuhua Yu's analysis of the three misconceptions in building financial infrastructure for compute.
The procurement read
Buyers do not need to think in coefficients of variation to use the data, but the implications for procurement are direct.
If you are an enterprise AI team sizing a training run or planning a six-month H100 deployment on a hyperscaler, the April-20 print of $7.48 is essentially the same number you would have budgeted against in early March. The budget you set on day one of a quarter is the budget you will still be running against on day ninety. That is not a claim about the future — it is an observation about what the market has done for fifty consecutive trading days, across a period that included NVIDIA's largest industry event of the year.
Two practical consequences follow:
Lock decisions can be made on non-price factors. When on-demand rates do not move, the question "should I commit to a reserved contract now or wait for a dip?" becomes less urgent. The answer is increasingly driven by utilization certainty, data-gravity considerations, and negotiated enterprise terms rather than by timing the index. For teams that want to model that trade-off against live market data, SiliconNavigator tracks both Hyperscaler and Neocloud rates across providers, regions, and commit terms.
The Neocloud tier is a different animal. H100 Hyperscaler sits at roughly a 3× premium to the H100 Neocloud tier, and the Neocloud tier moves more. For workloads where bare-metal is viable and enterprise SLAs are not required, the cost differential remains the decisive variable. But conflating the two tiers in a procurement model produces the wrong risk profile in both directions. The Hyperscaler tier is stable; the Neocloud tier is cheaper and more volatile. They are priced as different products because they are different products.
What would make the index move
It is worth being clear about what is not being claimed. The index has been quiet. That is not the same as saying the index will stay quiet.
Three categories of event would likely break the regime. A discrete supply shock — a chip allocation change, a major hyperscaler reconfiguring its commercial model, a new entrant with aggressive pricing — would force the ceiling to adjust. A shift in the reserved-vs-on-demand mix driven by NVIDIA's next generation moving the performance-per-dollar frontier would pull some enterprise demand off H100 and reprice the residual. And a macro-level change in AI training economics — a regulatory event, a major capital-allocation shift across the hyperscalers — would show up in the on-demand rate before it showed up anywhere else.
None of those is currently in the data. The data currently shows a market that has been running flat for seven weeks. If any of those events materialize, the index will move, and the move will itself be informative. A benchmark that sits still until it does not is behaving the way benchmarks are supposed to behave.
The quiet is half the story
The GPU market in 2026 is running at two speeds. B200 is in the volatile, re-rating, high-information-density phase that every chip generation passes through. H100 Hyperscaler is in a different phase — one where the rate sits still between events, moves sharply at them, and mean-reverts afterward. That is not the absence of volatility. It is structured volatility, and it behaves the way more mature commodity benchmarks behave in their early years.
For institutional readers, that structure is what matters. Swaps, covenants, parametric triggers, and forward pricing all rely on a spot reference that is published, methodology-disclosed, and statistically tractable. The SDH100RT Neocloud index has been the starting point for that work since launch. The Hyperscaler index adds a second reference point — one with a different volatility profile, sitting at a different tier of the market, covering a different population of counterparties — and with its own specific event-risk signature that product design has to account for.
The AI compute market now has what every financialized commodity eventually produces: a rate that moves when there is news, sits still when there is not, and accumulates the track record needed to eventually support long-dated products. That track record is still being built. The seven weeks of data covered here is a useful chapter, not the whole book.
Frequently Asked Questions
It is Silicon Data's daily benchmark tracking on-demand H100 rental rates on the enterprise-SLA hyperscaler tier. Between March 1 and April 20, 2026 it traded in a $7.40–$7.52 band, was unchanged on 39 of 50 daily transitions, and posted a 0.47% coefficient of variation.
It is one of the published spot references that anchor the front of the curve. The SDH100RT Neocloud index has been the starting point for forward and swap work; the Hyperscaler index adds a second reference point at a different market tier — though, as a price ceiling above reserved capacity rather than a cleared spot mark, the no-arbitrage forward rate and the Neocloud index remain the more natural references for swap and forward pricing.
Neither a coincidence nor yet a proven long-run regime. The quiet has a clean structural cause — a mature chip, contracted (not spot) supply, and switching-cost-constrained demand — but fifty trading days is too short to establish the 12–24 month stability credit models need. The tier is stable between events and shock-sensitive at them, as the +1.48% jump during NVIDIA GTC on March 23 showed.
It tracks published on-demand H100 hourly rates on the hyperscaler tier — effectively a ceiling posted above a large book of already-priced reserved capacity — rather than clearing a spot market. That administrative structure is part of why the series moves so slowly.
Not yet. Clearinghouses typically require benchmark history measured in years, and because the index is a price ceiling rather than a cleared spot mark it is a conceptual mismatch for cleared swaps today. It has candidate properties and is useful now for reservation-pricing benchmarks and credit stress-test overlays while its track record accumulates.