
Hopper and Ampere rents are rising, but the 30–50% is a reset, not a quarter
CoreWeave said Ampere and Hopper pricing rose 30–50% quarter over quarter. Our indices rose 2–13% in Q3, but measured from 2025 the H100 index sits inside that range.

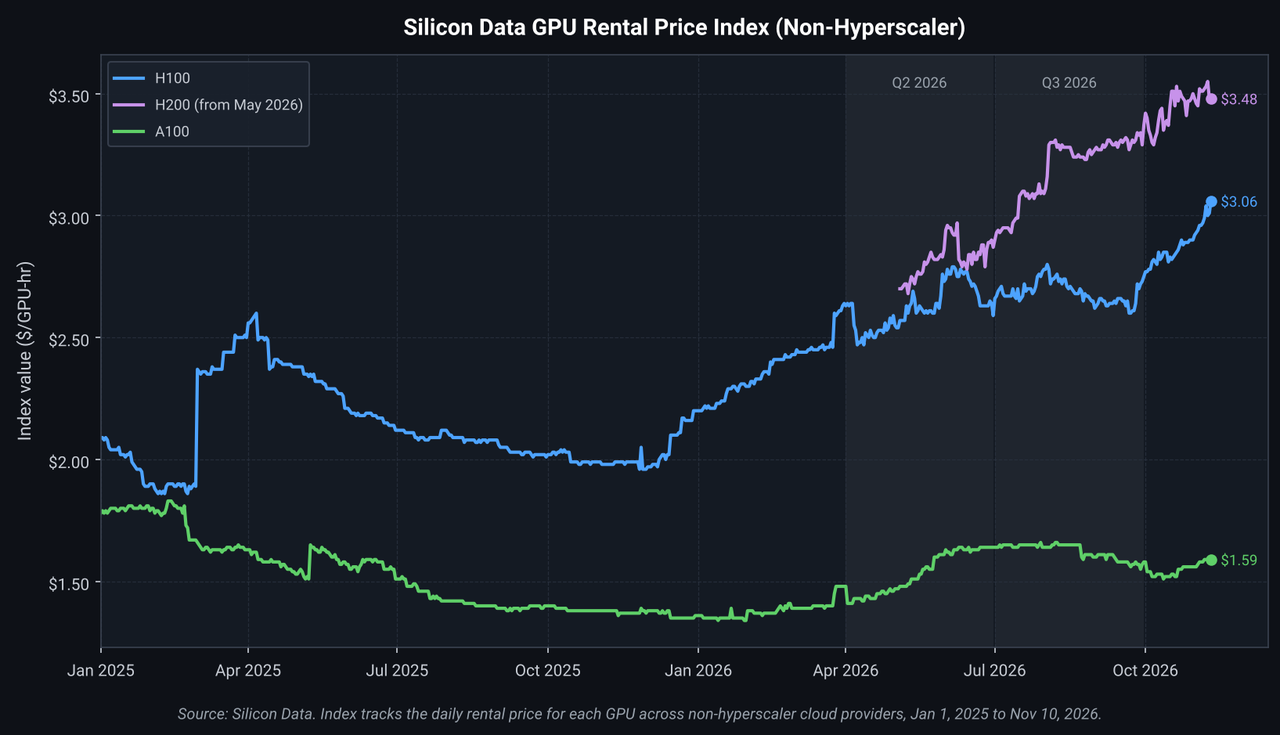
GPU rental indices · A100 · H100 · H200 · Jan 2025 to Nov 10, 2026
On its Q3 2026 earnings call on November 10, CoreWeave said pricing for its prior-generation Ampere and Hopper fleet rose 30 to 50% quarter over quarter, at prices above the original contracts, and that more than 130,000 GPUs come off contract in 2027 and about 170,000 in 2028. This note checks that claim against Silicon Data's market indices and asks what the two measures are each capturing.
Key takeaways
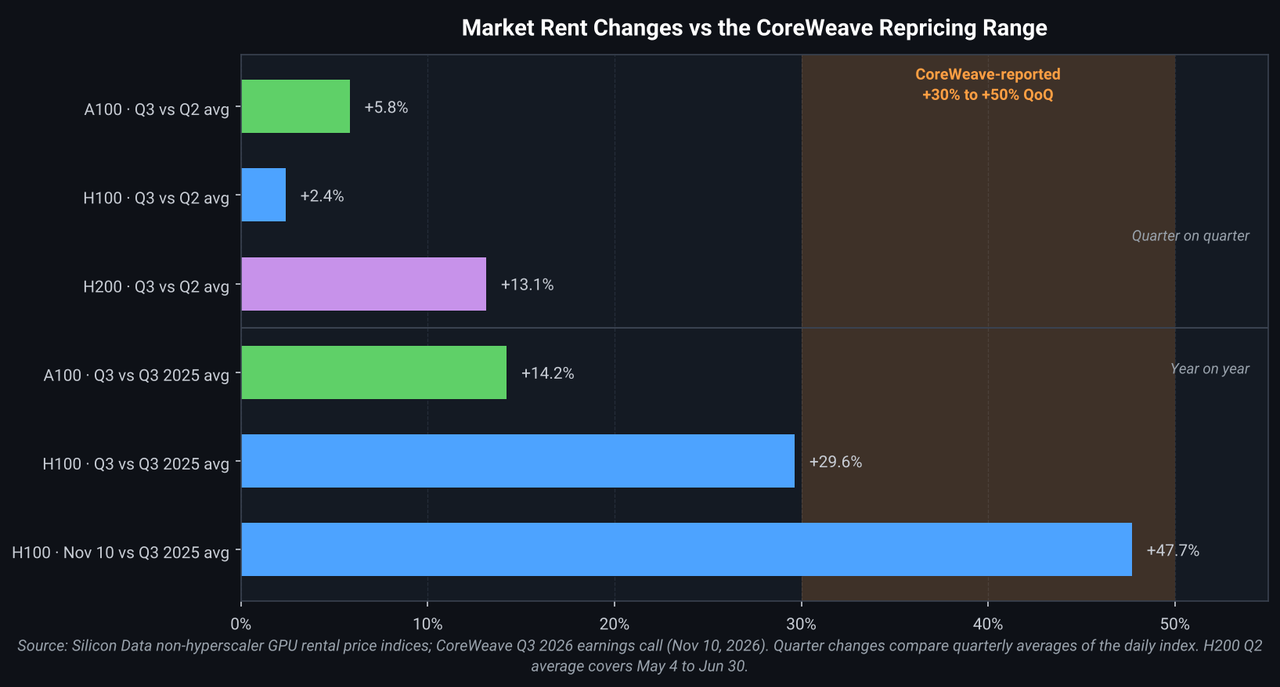
- Direction confirmed, magnitude not. Our non-hyperscaler indices rose in Q3, but by +2.4% (H100), +5.8% (A100) and +13.1% (H200) on quarterly averages, well short of 30–50% quarter on quarter.
- 30–50% matches the move off 2025 levels. The H100 index averaged 29.6% more in Q3 2026 than in Q3 2025 and is now 47.7% above that level. Contracts struck in 2025 and repriced today would land in CoreWeave's range.
- The steepest leg is in Q4. The H100 index is up 11.3% since Sep 30 to $3.06/GPU-hr on Nov 10, its highest level since at least January 2025.
Terms used in this note
- Ampere, Hopper: NVIDIA GPU generations. Ampere is the A100 (2020); Hopper is the H100 and H200 (2022–24). Both are now one or two generations behind Blackwell.
- Non-hyperscaler (Neo) index: Silicon Data's daily index of GPU rental prices posted by neocloud and other non-hyperscaler providers, in dollars per GPU-hour.
- Hyperscaler (HS) index: The same measure for the large public clouds, whose list prices are higher and change less often.
- Quarter on quarter (QoQ): Here, the average of the daily index over Q3 2026 compared with its Q2 2026 average, unless stated as a quarter-end change.
- 12-month implied rate: From Silicon Data's forward curve: the average hourly price implied for a one-year rental starting today.
- Contract roll: When a multi-year GPU contract expires and the capacity is re-signed, at whatever the market pays at that point.
Market rents rose in Q3, by single digits
Neo index · $/GPU-hr · Q2 vs Q3 2026
All three chips we track rose between Q2 and Q3 on average, so the direction CoreWeave describes is visible in the open market. The size is not. H100 rents gained 2.4% on quarterly averages and 6.2% from quarter-end to quarter-end. A100 gained 5.8% on averages but slipped 3.7% across the quarter as a whole after peaking in August. H200 moved most, up 13.1% on averages.
| Index | Q2 avg | Q3 avg | Change (avg) | Jun 30 | Sep 30 | Change (end) |
|---|---|---|---|---|---|---|
| A100 · Neo | $1.54 | $1.62 | +5.8% | $1.64 | $1.58 | −3.7% |
| H100 · Neo | $2.62 | $2.69 | +2.4% | $2.59 | $2.75 | +6.2% |
| H200 · Neo | $2.82 | $3.19 | +13.1% | $2.87 | $3.37 | +17.4% |
| A100 · HS | $3.70 | $3.73 | +0.9% | $3.71 | $3.76 | +1.3% |
| H100 · HS | $7.45 | $7.21 | −3.1% | $7.26 | $7.20 | −0.8% |
| H100 · 12-month implied | — | — | — | $2.32 | $2.40 | +3.5% |
| A100 · 12-month implied | — | — | — | $1.53 | $1.46 | −4.1% |
The term market tells the same story: the price of locking in an H100 for a year rose 3.5% over the quarter, and for an A100 it fell 4.1%. Hyperscaler list prices were flat to slightly lower. H200's Q2 average starts on May 4, when its series begins, so its change is the least comparable of the three.
Measured from 2025, the market sits inside CoreWeave's range
Neo index · year on year · Q3 2025 to Nov 10, 2026
| Measure | Level | Note |
|---|---|---|
| H100 · Q3 2025 average | $2.07 | 2025 low $1.86 (Feb 5) |
| H100 · Q3 2026 average | $2.69 | +29.6% year on year |
| H100 · Nov 10, 2026 | $3.06 | +47.7% vs Q3 2025 average |
| A100 · Q3 2026 average | $1.62 | +14.2% YoY; +21% vs Jan 2026 low of $1.34 |
The 30–50% range looks much less unusual against a year-earlier base. H100 rents bottomed near $2 through late 2025 and have climbed for most of 2026, with a pause from June to September. A contract signed in mid-2025 and re-signed today at market would reprice by roughly 30 to 48% on our H100 index, which is the band CoreWeave cited.
Three readings of the gap
A contract-roll base effect. CoreWeave's figure describes its own pricing, and its fleet reprices only when contracts roll. If the Q3 comparison is between capacity re-signed in Q3 and the rates that capacity carried before, the base is a 2024–25 contract price rather than last quarter's market, and our year-on-year numbers line up with it. This is the reading most consistent with our data.
A different product. CoreWeave sells large, interconnected clusters on multi-year terms. Our Neo index tracks posted rental prices, not negotiated cluster contracts. A scarcity premium for contiguous Hopper clusters could rise faster than posted rates without showing up in the index.
A lead over the public market. The sharpest move in our H100 series came after the quarter closed, +11.3% from Sep 30 to Nov 10. Contract pricing that tightened in Q3 may be showing up in posted rates with a lag.
These readings are not mutually exclusive, and our data cannot separate them on its own. Q4 index levels and the H100 term curve over the next two months will help: a roll effect predicts posted rents keep grinding up at a moderate pace, while a lag predicts the index catches up toward CoreWeave's range.
What our data does and does not observe. The indices measure rental prices posted by cloud providers. They do not observe CoreWeave's privately negotiated contracts, so we cannot test the claim that new pricing sits above the original contracts, or the revenue implied by renewing the 2027–28 expiries.
What to watch
Q4 H100 average. At $3.06 on Nov 10, the H100 index is already 14% above its Q3 average. If it holds, Q4 will be the first quarter in which the public market shows a double-digit sequential rise.
A100 versus Hopper. A100 rents are up from their January low but fell through September; CoreWeave groups Ampere with Hopper, while the market is pricing them apart.
The 2027–28 roll. About 300,000 GPUs rolling in 2027–28 will reprice against whatever the term curve says then. At the end of Q3 the H100 12-month implied rate was $2.40, below the $2.75 index level that day, so the forward curve still priced some easing.
Method and sources
Method. Silicon Data non-hyperscaler (Neo) and hyperscaler (HS) daily GPU rental price indices for A100, H100 and H200, Jan 1, 2025 to Nov 10, 2026 (H200 from May 4, 2026; HS shown from Apr 1, 2026). Quarterly changes compare the mean of daily index values in each calendar quarter. 12-month implied rates are the forward-curve implied average price of a 12-month rental starting on the observation date (Jun 30 and Sep 30, 2026). CoreWeave's figures are as stated on its call; we have not adjusted them.
Reading the charts. Index levels are plotted raw, without smoothing. In the bar chart, the shaded band marks CoreWeave's stated 30–50% quarter-on-quarter range; bars above the divider are quarter on quarter, bars below are year on year or longer.
Sources. Silicon Data GPU rental price indices and forward curves; CoreWeave Q3 2026 earnings call, November 10, 2026.
Frequently Asked Questions
On its Q3 2026 earnings call on November 10, CoreWeave said pricing for its prior-generation Ampere and Hopper fleet rose 30 to 50% quarter over quarter, at prices above the original contracts, and that more than 130,000 GPUs come off contract in 2027 and about 170,000 in 2028.
No. Our non-hyperscaler indices rose in Q3, but by +2.4% (H100), +5.8% (A100) and +13.1% (H200) on quarterly averages, well short of 30–50% quarter on quarter. Measured from 2025, the market sits inside CoreWeave's range: the H100 index averaged 29.6% more in Q3 2026 than in Q3 2025 and is now 47.7% above that level.
Three readings fit, and they are not mutually exclusive: a contract-roll base effect, where re-signed capacity is compared with 2024–25 contract prices rather than last quarter's market; a different product, since CoreWeave sells large, interconnected clusters on multi-year terms while our index tracks posted rental prices; and a lead over the public market, where contract pricing that tightened in Q3 shows up in posted rates with a lag.