H100 Index, May 2026: Same Chip, Two Tiers, Two Regimes
Over the same spring window, H100 Hyperscaler rates stayed flat while the Neocloud tier rose double digits. Why Silicon Data tracks the two separately.

Last month we described the H100 Hyperscaler index as a benchmark in flat mode: a rate that held inside a twelve-cent band for fifty trading days, at a 0.47% coefficient of variation. The Neocloud tier of the same chip behaves differently — cheaper, and more variable. April and May let us show both on the same 61-day window.
Over those two months, the Hyperscaler index moved +0.27% end to end, inside a peak-to-trough range of about 2%. The Neocloud index moved +3.8% end to end, but over a far wider path: from a $2.47 trough on April 8 to a $2.76 peak on May 30, an 11.7% trough-to-peak swing. Same chip, same eight weeks, same end-to-end direction — but one tier traced a roughly 2% range and the other an 11.7% one. That difference is the reason the two are tracked as separate series, and it is the subject of this update.
The two regimes in one chart
Rebasing both indices to 100 on April 1 and overlaying them shows the divergence directly.
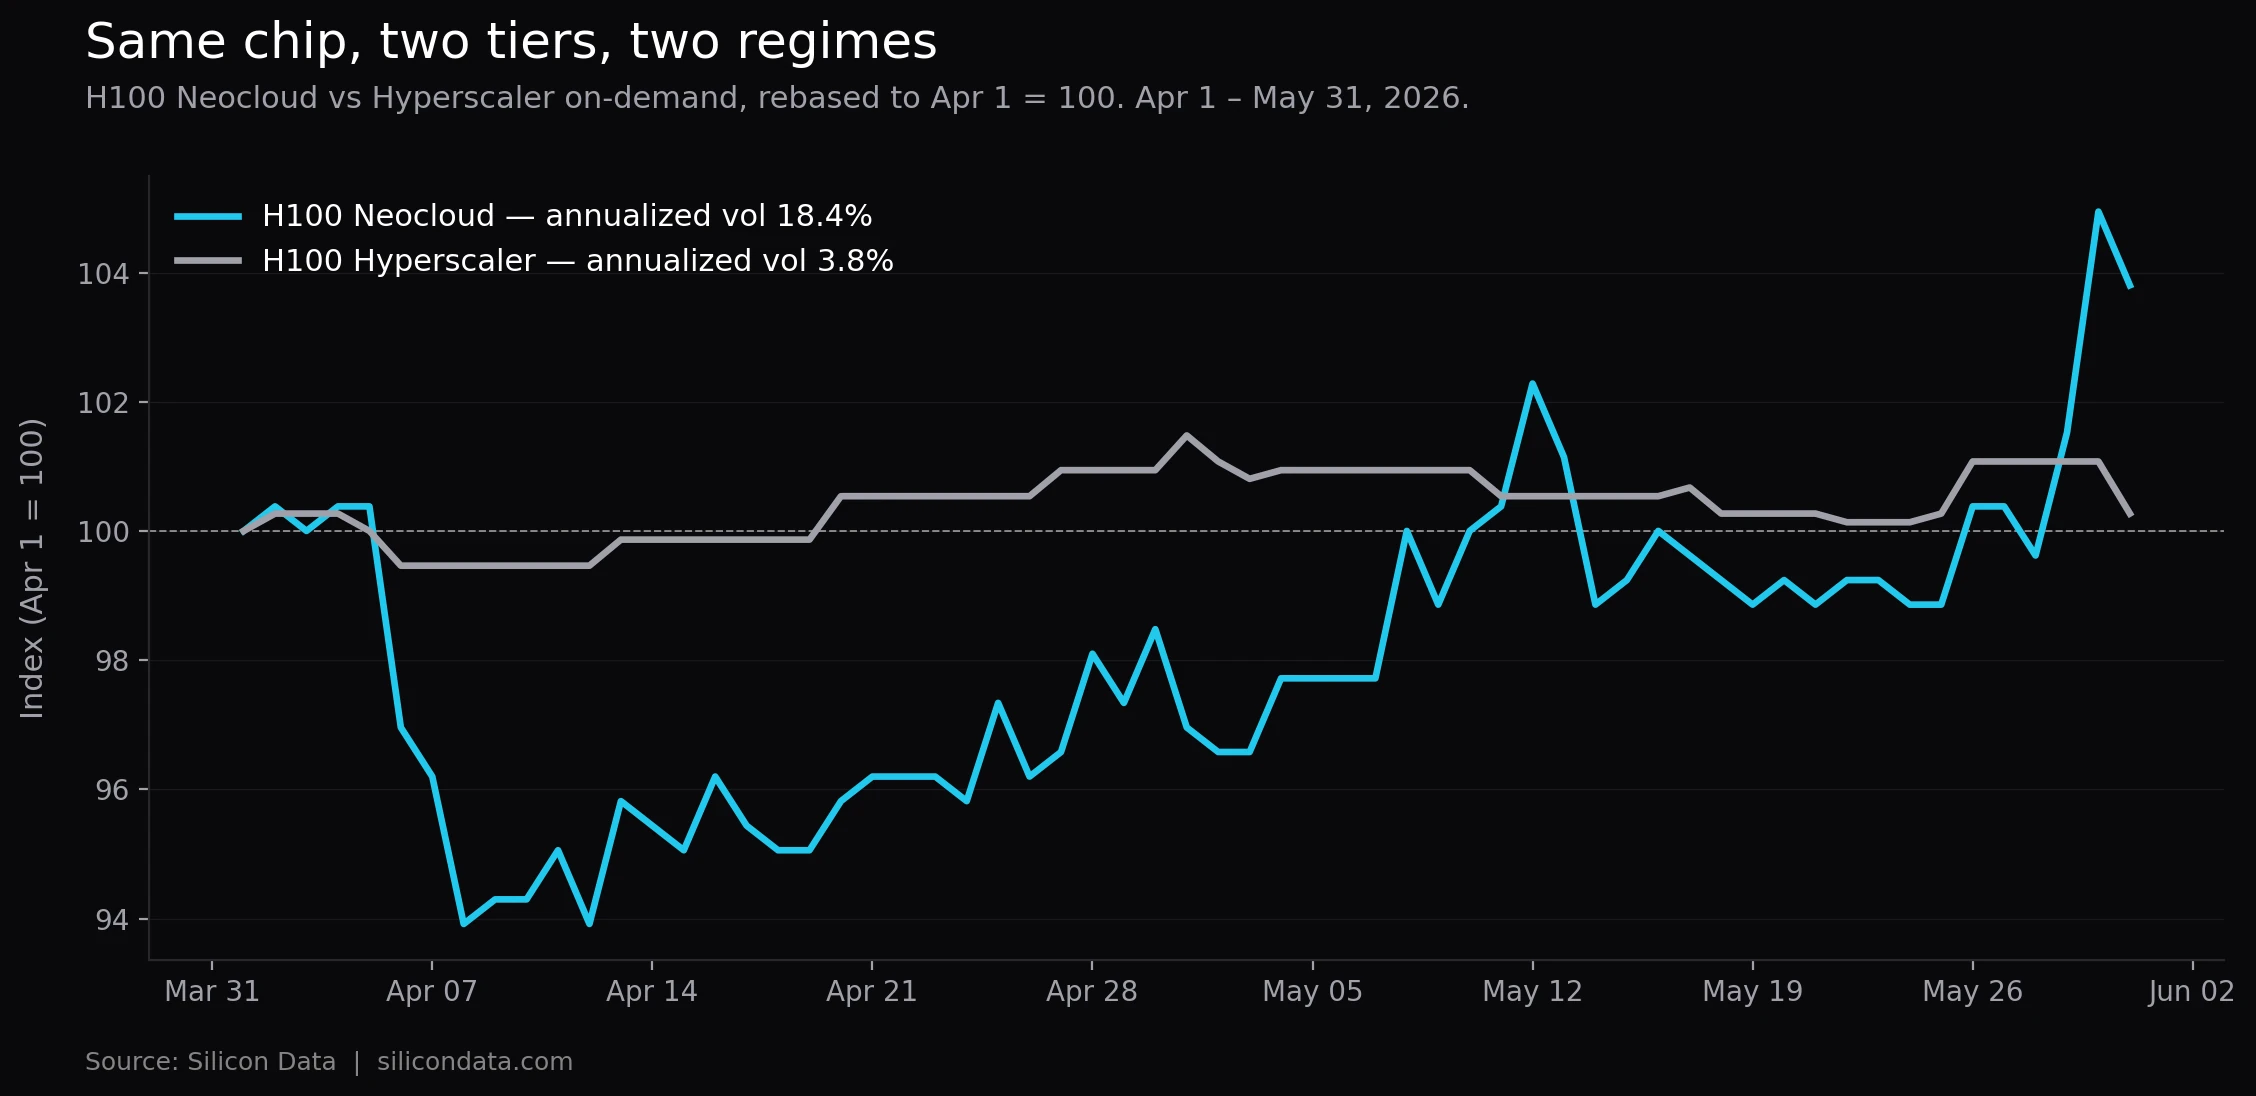
The Hyperscaler tier (gray) stays within a two-point channel for the full window. The Neocloud tier (cyan) drops six points in the first week, recovers, and rises to new highs at the end of May. The two series track the same hardware and share little short-term behavior.
Reduced to one statistic each: annualized volatility — the standard deviation of daily index returns scaled by √252 — ran 3.8% for the Hyperscaler index across April and May and 18.4% for the Neocloud index, roughly five times higher. The gap reflects two different market structures renting the same chip.
The Hyperscaler tier: flat through May
The Hyperscaler index opened April at $7.44, drifted to $7.51 by month-end, opened May at $7.55, and closed the period at $7.46. The full-window band was $7.40 to $7.55 — fifteen cents of range across two months. It was unchanged on 43 of 60 daily transitions, the mean absolute daily move was under a cent, and the largest single move was six cents.
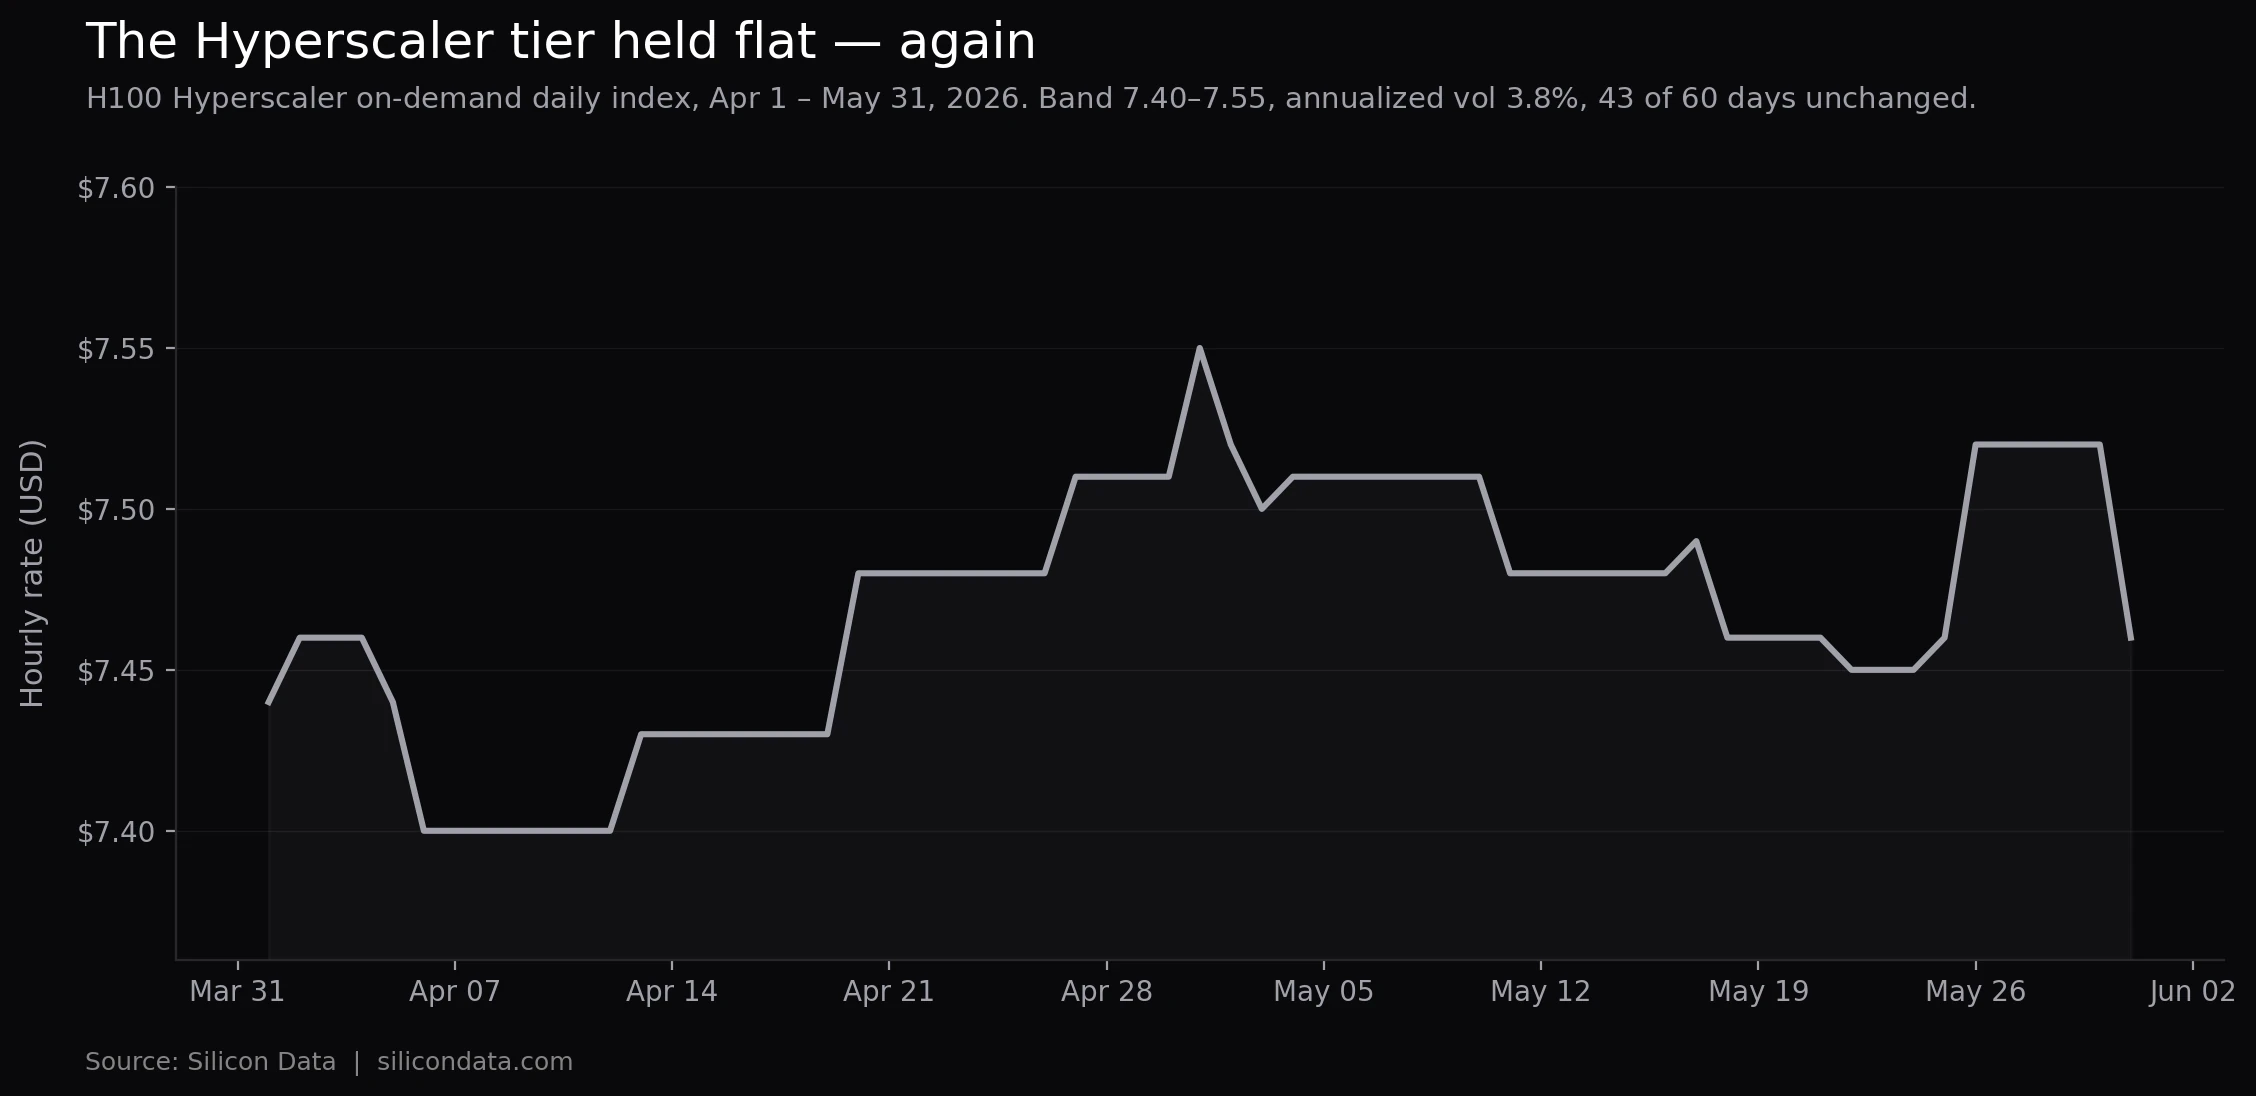
There was no repeat of the March 23 GTC spike flagged last month as the one event-driven exception — the same conference-week pulse that coincided with higher B200 pricing in late March. With no comparable event this window, the rate held near $7.47.
The likely explanation is the structural one given in April. The Hyperscaler tier functions as a price ceiling that AWS, Azure, and Google Cloud post above a large book of already-priced reserved capacity. That ceiling reprices occasionally rather than daily, because the reserved book underneath it turns slowly, and the workloads that remain on this tier are generally held by enterprise SLAs, data gravity, and compliance — so demand appears relatively insensitive to small price changes. For a mature chip two years into its commercial lifecycle, a stable administered rate is the expected result.
The Neocloud tier: a more active market
The Neocloud index opened April at $2.63, fell to a $2.47 trough by April 8 — about 6% in a week — then recovered most of the way back, closing April at $2.59. The early-April dip coincided with a post-GTC softening in demand, and the recovery is consistent with the market reabsorbing that slack.
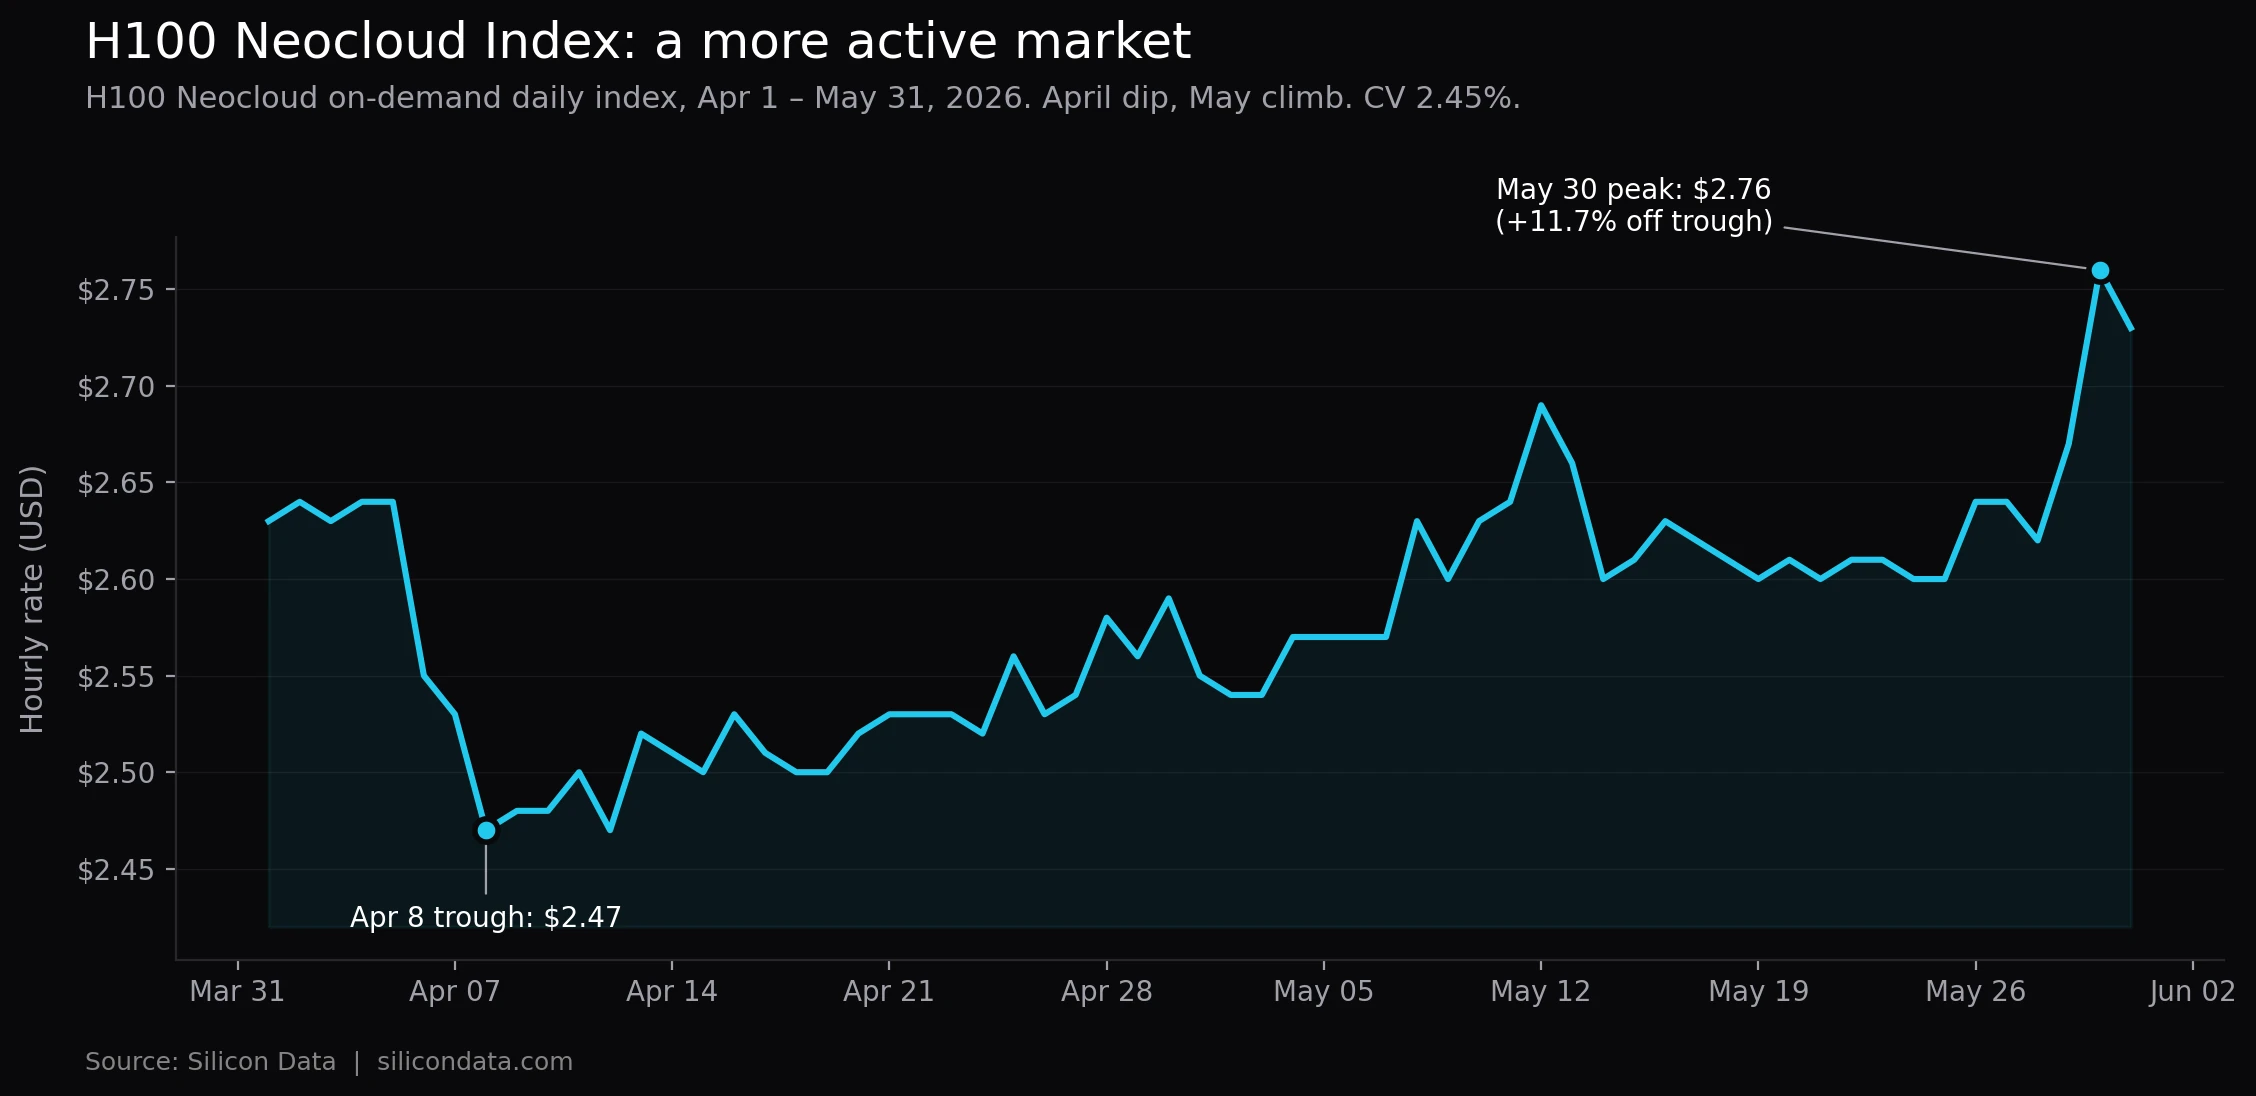
May moved the other way. The index opened at $2.55 and rose in steps to $2.73 by May 31, peaking at $2.76 on May 30 — up 7.1% for the month, with the largest single session a nine-cent move. Across the full window the split was even (24 up days, 24 down, 12 flat), but the May sessions skewed positive.
Three structural features plausibly account for why the Neocloud tier reprices while the Hyperscaler tier holds:
Capacity is sold short and re-cleared often. Neocloud capacity — from providers such as CoreWeave, Lambda, Crusoe, and Nebius — is typically rented on commitments of weeks or months rather than the multi-year reservations common on the hyperscaler book. New capacity coming online, or a reservation expiring back into the available pool, clears at the prevailing weekly rate. The April dip is consistent with that mechanism.
The marginal Neocloud buyer is more price-elastic. Workloads on bare-metal-style infrastructure carry lower switching costs, so a buyer may move to capture a meaningful saving, transmitting demand changes into price within days. On the Hyperscaler tier, the remaining workloads are generally those for which price is not the deciding variable.
There is no administered ceiling damping the series. Without a large reserved book underneath the rate, the Neocloud index reflects more of the underlying supply-demand balance. The May demand pickup appears in the Neocloud series and is largely absent from the Hyperscaler rate; the premium between the two tiers narrowed over the month.
What each tier is for
The Hyperscaler index suits structured reservation pricing and enterprise budgeting. Its stability is the point: a team negotiating a multi-year committed-use agreement can anchor discount spreads against a slow-moving reference, and a budget set in early April was still broadly accurate on May 31.
The Neocloud index suits spot-exposed decisions and demand monitoring. A team renting capacity month to month is exposed to the variability the series captures, and a research or risk team looking for early signs of shifting AI-infrastructure demand will tend to see it here first, since demand transmits into this tier with less lag. SiliconNavigator tracks the underlying provider-level rates daily.
The two also differ as references for financial products. The Neocloud series, with more continuous price discovery, is the more natural underlying for instruments tied to H100 rental exposure; the Hyperscaler series is better suited as a reservation-pricing reference. For the broader argument on why benchmarks like these matter for compute financialization, see Yuhua Yu's three misconceptions in building the financial infrastructure for compute.
Why two indices, not one
The Neocloud index is the one Silicon Data distributes on Bloomberg, under the ticker SDH100RT; it stood at $2.75 in early June, up 12.7% over the trailing three months. The Hyperscaler index is published alongside it through the Silicon Index family. The two are kept separate by design rather than blended into a single H100 number.
That is the case for tracking both. Blending them into one number would average away the stability that makes the Hyperscaler series a budgeting anchor and the responsiveness that makes the Neocloud series an earlier read on demand. They answer different questions, and the spring of 2026 — one tier inside a 2% range, the other swinging nearly 12% over the same days — is a clear illustration of the difference. Whether the Neocloud strength continues is a question the June data will help answer.
Frequently Asked Questions
Both track on-demand H100 rental rates, on different tiers of the market. The Hyperscaler index covers the enterprise-SLA tier (AWS, Azure, Google Cloud) and behaves like an administered price ceiling — stable and slow-moving. The Neocloud index covers specialist providers (CoreWeave, Lambda, Crusoe, Nebius) and behaves more like a competitive on-demand market. The Neocloud tier trades at roughly a third of the Hyperscaler rate.
Market structure. The Neocloud tier sells capacity in short commitments and competes directly on price, so supply and demand changes appear in the index within days — consistent with the April dip and the May climb. The Hyperscaler tier posts a ceiling above a large reserved book that reprices only occasionally, and it stayed flat over the same window.
For multi-year reserved agreements and quarterly budgeting, the Hyperscaler index is the more stable reference. For month-to-month rental decisions or as an earlier read on AI-infrastructure demand, the Neocloud index is the relevant series.
It is consistent with AI-infrastructure demand firming into a tighter available-capacity picture, with no administered buffer to absorb it. The same pickup is largely absent from the Hyperscaler rate. We note this as an interpretation; the series itself shows the move, not its cause.
Both indices publish daily. The Neocloud index is on Bloomberg under the ticker SDH100RT, and the Hyperscaler index is published alongside it through the Silicon Index product. SKU- and provider-level rental detail is available through SiliconNavigator.