
H100 Rental Prices by Region (Q3 2026): The Hyperscaler Premium Has Halved
Hyperscaler H100 rates fell 26 to 54% by region since Q1 2025 while non-hyperscaler rates recovered, compressing the hyperscaler premium from roughly 250% to about 120% across the seven regions we track.

At the start of 2025, renting an H100 from a hyperscaler cost 3 to 4.5 times the non-hyperscaler rate, depending on region. As of Q3 2026, the multiple averages roughly 2 to 2.5 times. The premium is still substantial, at about 120% on average across the seven regions we track, but it is close to half what it was eighteen months ago.
That compression, and where it did and did not happen, is the story in our latest quarterly regional cut of H100 GPU rental prices from our H100 Rental Price Index.
The Premium, Measured
Hyperscalers price H100 rentals at a persistent premium to non-hyperscaler providers, the tier often described as neoclouds, in every region we track. The premium reflects more than the GPU. Hyperscaler rates bundle ancillary value that non-hyperscaler providers typically do not carry: managed orchestration and the surrounding platform services, enterprise support agreements and SLAs, certified compliance regimes for regulated workloads, security posture that has already cleared enterprise procurement review, and integration with the data, storage, and networking ecosystem a large customer is often already running on. Buyers paying the premium are, at least in part, paying for that bundle, and for some workloads, regulated inference close to existing cloud data being the clearest case, the bundle is the product.
For other workloads the calculus is different. A self-contained training run that needs racks of H100s, a scheduler, and little else consumes almost none of the bundle, which is why the same GPU-hour can rationally clear at very different prices in the two tiers.
The size of the premium varies widely by region. At Q3 2026, the multiple runs from roughly 1.6x in the Nordics to roughly 3x in US West and the Middle East, with most regions clustered near 2x. For the structural background on the two tiers, see our earlier read on the H100 Hyperscaler index.
Where the Compression Came From
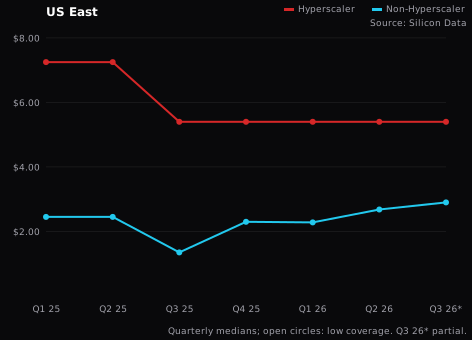
The narrowing since Q1 2025 is primarily a hyperscaler story. Hyperscaler H100 rates fell in every region, but at very different speeds: roughly 26% in US East, around 30% in US West and the Middle East, just over 40% in Canada, the Nordics, and Europe, and about 54% in Asia-Pacific, the steepest decline in the panel.
Most of that adjustment happened in two steps. The first was a sharp reset around Q3 2025, visible as a cliff in nearly every regional chart, after which several regions sat flat for two or more consecutive quarters. The second was a slower grind through the first half of 2026. The timing of the first step coincides with the period in which B200 capacity began arriving at scale, consistent with newer-generation supply repricing the H100 tier below it, though the quarterly series alone cannot attribute the move to any single cause.
Non-hyperscaler rates tell a different story. They dipped through mid-2025, US East touched roughly $1.35 in Q3 2025 and Canada and the Nordics bottomed near $1.60 to $1.75 in early 2026, before recovering into 2026. By Q3 2026, non-hyperscaler rates in US East and the Nordics sit at or above their Q1 2025 levels, around $2.90 and $3.30 respectively. A falling numerator and a recovering denominator compressed the ratio from both sides.
Region by Region
US East. The cheapest hyperscaler market at the start and the least changed: roughly $7.25 in Q1 2025 to about $5.40 by Q3 2025, then flat for a full year, the longest unbroken plateau in the panel. The non-hyperscaler side is the more eventful series here, falling to roughly $1.35 in Q3 2025 before climbing steadily to about $2.90, the strongest recovery among US regions.
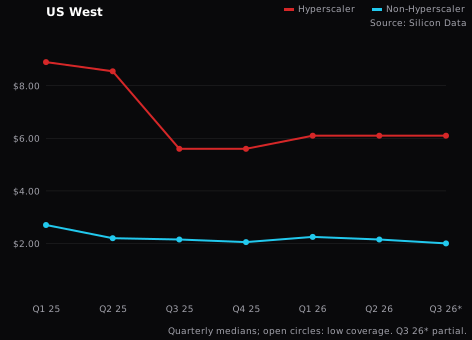
US West. Hyperscaler rates fell from roughly $8.90 to about $5.60 by late 2025, then partially rebounded to around $6.10, one of only two regions with any hyperscaler price recovery. Non-hyperscaler rates drifted the other way, from about $2.70 to roughly $2.00, leaving US West with one of the widest current multiples at roughly 3x.
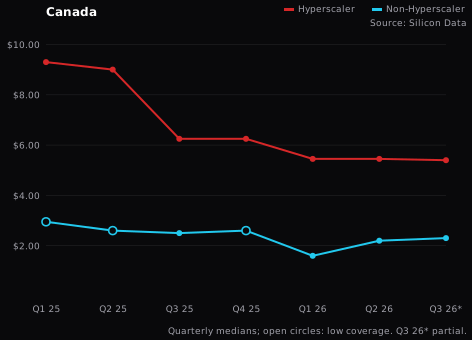
Canada. A steady stair-step down on the hyperscaler side, from roughly $9.30 to about $5.40, with no plateau longer than two quarters. Non-hyperscaler pricing bottomed near $1.60 in Q1 2026 and recovered to roughly $2.30. Early-2025 non-hyperscaler quarters carry low coverage, so the start of that series reads with wider uncertainty.
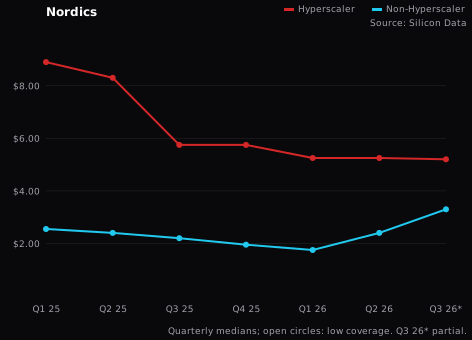
Nordics. The most complete convergence in the panel. Hyperscaler rates roughly halved, from about $8.90 to $5.20, while non-hyperscaler rates rose from a Q1 2026 low near $1.75 to roughly $3.30, the highest non-hyperscaler level in any region and above where the series started. The resulting multiple, about 1.6x, is the narrowest we track, consistent with regional capacity tightness on the non-hyperscaler side.
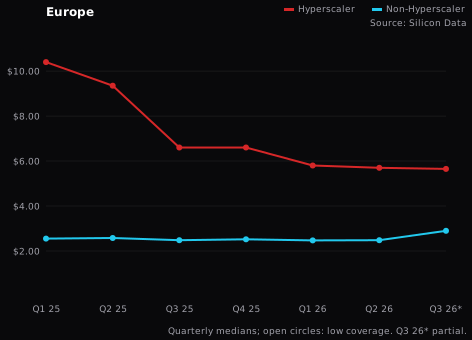
Europe. The second-richest hyperscaler market at the start, above $10.40, and one of the larger declines, roughly 46% to about $5.60. Non-hyperscaler pricing was the most stable series in the panel, holding a tight band around $2.50 for six quarters before firming to roughly $2.90 in the partial current quarter.
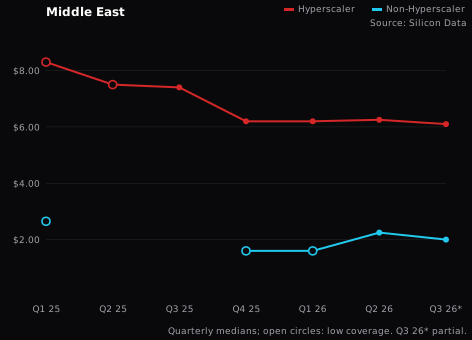
Middle East. Directionally similar to the rest, from roughly $8.30 to about $6.10 on the hyperscaler side, but this is the region to read with the most caution: low-coverage quarters run through much of 2025 on both tiers, and the non-hyperscaler series only fills in cleanly from mid-2025.
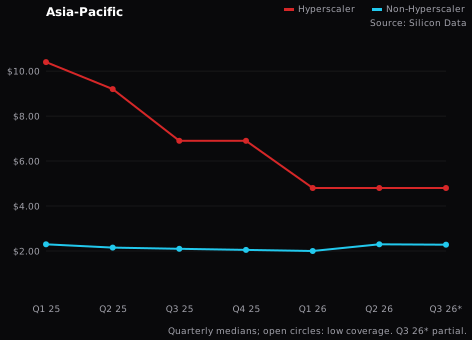
Asia-Pacific. The steepest repricing in the panel. Hyperscaler rates started tied with Europe at roughly $10.40 and ended lowest of all seven regions at about $4.80, a decline of roughly 54%, while non-hyperscaler rates barely moved from a $2.00 to $2.30 band. Nearly all of the region's convergence came from one side.
The Regional Spread Is Its Own Finding
The dispersion across regions is as informative as the averages. Two markets that began within pennies of each other, Europe and Asia-Pacific at roughly $10.40, ended more than $0.80 apart after diverging by more than 8 percentage points of decline. US East, which started cheapest among hyperscaler markets, moved least. And the Nordics show that convergence can come from the non-hyperscaler side rising, not only from hyperscalers cutting.
For buyers, the practical read is that region is now a live variable in H100 procurement rather than a rounding error, extending what our earlier US-regions cut of A100 and H100 rental pricing showed domestically to the global panel. At Q3 2026, the spread between the cheapest and richest hyperscaler market is roughly $1.30 per GPU-hour, and on the non-hyperscaler side roughly $1.30 as well, differences that compound quickly at cluster scale. Workloads without data-residency constraints can arbitrage that spread; workloads with them are, in effect, paying a regional premium on top of the tier premium, and can now put a number on it.
A note on coverage: open circles in the charts mark low-coverage quarters, concentrated in the Middle East through 2025 and Canada in early 2025. Reads for those region-quarters carry wider uncertainty, and Q3 2026 is a partial quarter to date in all regions.
What the Compression Does and Does Not Establish
The convergence is consistent with the market placing less incremental value on the hyperscaler bundle for pure GPU compute workloads: when the same silicon is available at a widening set of credible non-hyperscaler providers, the bundle has to justify the spread on its own.
What the data does not establish is the mechanism. Quarterly medians cannot distinguish list-price normalization from shifts in the mix of contracts and configurations behind each median, and a premium that halves can reflect changes on either side of the market. The regional dispersion argues against a single global explanation. What the series does support is narrower: the two tiers priced much further apart in early 2025 than they do today, and the gap has closed from both directions.
Both tiers are tracked daily in our H100 indices, with the longer price history in our review of H100 rental prices over time.
Conclusion
Eighteen months of quarterly data show a two-tier H100 market that still exists but prices much closer together than it did. Hyperscaler rates fell everywhere, at speeds that varied by a factor of two across regions; non-hyperscaler rates bottomed in mid-2025 and have firmed since. The premium that remains, roughly 2 to 2.5 times, is now the market's running estimate of what the hyperscaler bundle is worth per GPU-hour.
Source: Silicon Data. Quarterly median rental price by region and provider type. Open circles indicate low-coverage quarters; Q3 2026 is partial quarter to date.
Frequently Asked Questions
The rate carries more than the GPU: managed platform services, enterprise SLAs, certified compliance, security posture that has cleared procurement review, and ecosystem integration. For regulated or ecosystem-dependent workloads that bundle has real value; for self-contained compute workloads it is largely unused.
As of the partial third quarter of 2026, quarterly median rental prices per hour in the regions we track run roughly $2.00 to $3.30 at non-hyperscaler (neocloud) providers and roughly $4.80 to $6.10 at hyperscalers, depending on region.
On current partial-quarter medians, US West and Asia-Pacific are the cheapest non-hyperscaler markets at roughly $2.00 to $2.30 per GPU-hour, and Asia-Pacific is the cheapest hyperscaler market at about $4.80. Regional rankings have shifted repeatedly over the past six quarters.
Hyperscalers are the large integrated cloud platforms that sell GPU compute as part of a broad managed ecosystem of software, compliance, and platform services. Neoclouds are specialized GPU cloud providers that sell capacity closer to the bare GPU-hour, typically at lower rates with a thinner service layer. The price gap between the two tiers is the premium this article measures.
On this data, yes. The average premium across seven regions has fallen from roughly 250% in early 2025 to about 120% in the current partial quarter, driven by hyperscaler price declines of 26 to 54% by region and a partial recovery in non-hyperscaler rates.